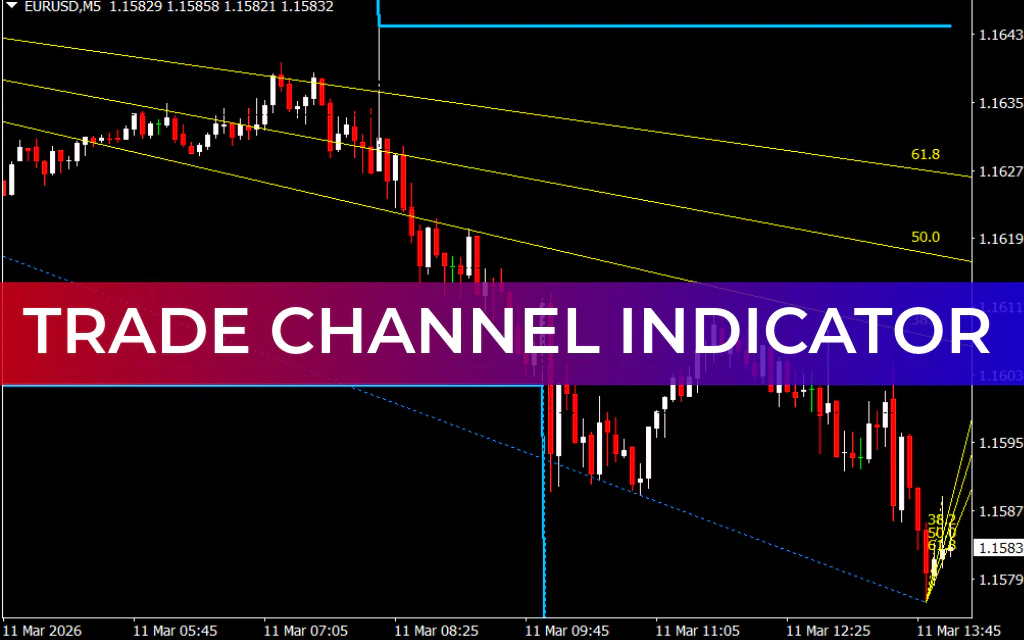
The Trade Channel Indicator for MetaTrader 4 (MT4) is a powerful technical analysis tool designed to help traders identify key Support And Resistance levels. It assists in analyzing market trends and anticipating potential trend reversals at important price zones.
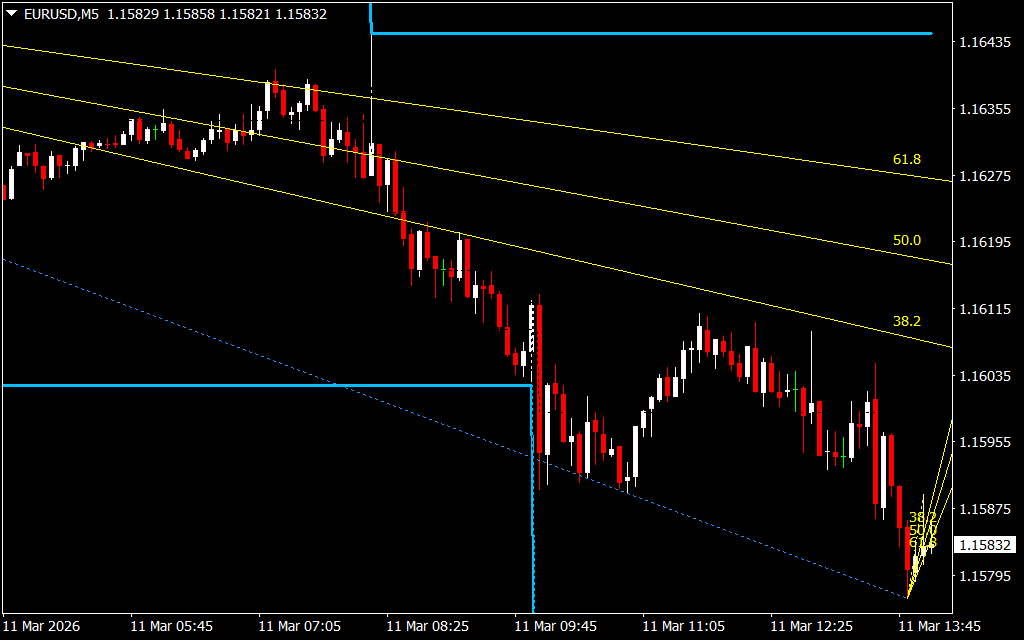
This indicator combines two well-known technical tools: RVM Fractal levels and Fibonacci retracement levels. By merging these two techniques, the Trade Channel Indicator creates a reliable system for spotting high-probability reversal areas and optimal trade entry or exit points.
Because of this combination, the indicator acts as a dual-purpose trading tool, helping traders both identify trend direction and trade potential reversals at critical market levels.
How the Trade Channel Indicator Works
The Trade Channel Indicator automatically draws a trading channel on the MT4 chart by detecting fractal levels and Fibonacci retracement points. These levels are plotted in alignment with the major market trend, helping traders avoid trades that go against the dominant direction.
The indicator displays:
- Deep blue thick lines – Represent key Fractal levels
- Yellow lines – Show Fibonacci retracement levels with percentage values
Together, these elements help traders identify areas where the market is likely to pause, reverse, or continue the trend.
Another advantage of the Trade Channel Indicator is its versatility. It can be used for:
- Scalping strategies
- Day trading and intraday trading
- Swing trading
It is suitable for beginner, intermediate, and advanced traders.
How to Trade with the Trade Channel Indicator
To improve accuracy, traders are encouraged to combine the indicator with Price Action analysis or additional technical indicators.
Buy Signal
In a bullish market trend, traders should wait for the indicator to plot both Fractal and Fibonacci levels.
A buy opportunity occurs when:
- The price retraces back and touches a Fractal or Fibonacci level
- The overall market trend remains bullish
Trading approach:
- Enter a BUY or long position
- Target the next resistance or Fibonacci level
Sell Signal
In a bearish market trend, traders should look for retracements toward the plotted levels.
A sell opportunity occurs when:
- The price touches the Fractal or Fibonacci level
- The broader trend is downward
Trading approach:
- Enter a SELL or short position
- Target the next support level
Example of a High-Probability Trade Setup
A strong SELL setup occurs when the price reaches a Fractal level that aligns with a major Fibonacci level, such as the 50.0% retracement.
This situation creates double confluence, meaning two technical factors support a potential Trend Reversal. Such setups often provide high-probability trading opportunities.
Conclusion
The Trade Channel Indicator for MT4 is an effective tool for identifying support and resistance zones with greater precision. By combining fractal levels and Fibonacci retracements, the indicator helps traders locate high-probability trend reversal areas and improve trade timing.
However, like any technical indicator, it is not a guaranteed system. For best results, traders should combine it with price action signals, such as wick rejections or bullish and bearish engulfing patterns, to increase trading accuracy.
FAQ
Published:
Mar 11, 2026 09:08 AM
Category: