The Traders Dynamic Index (TDI) is a popular technical analysis tool developed by Dean Malone. This powerful indicator combines several well-known indicators—including the Relative Strength Index, Moving Average, and Bollinger Bands—to deliver clear trading signals and a better understanding of market momentum and volatility.
Because it merges multiple indicators into one system, the TDI helps traders identify potential buy and sell opportunities, making it a valuable addition to any trading strategy.
How the TDI Indicator Works
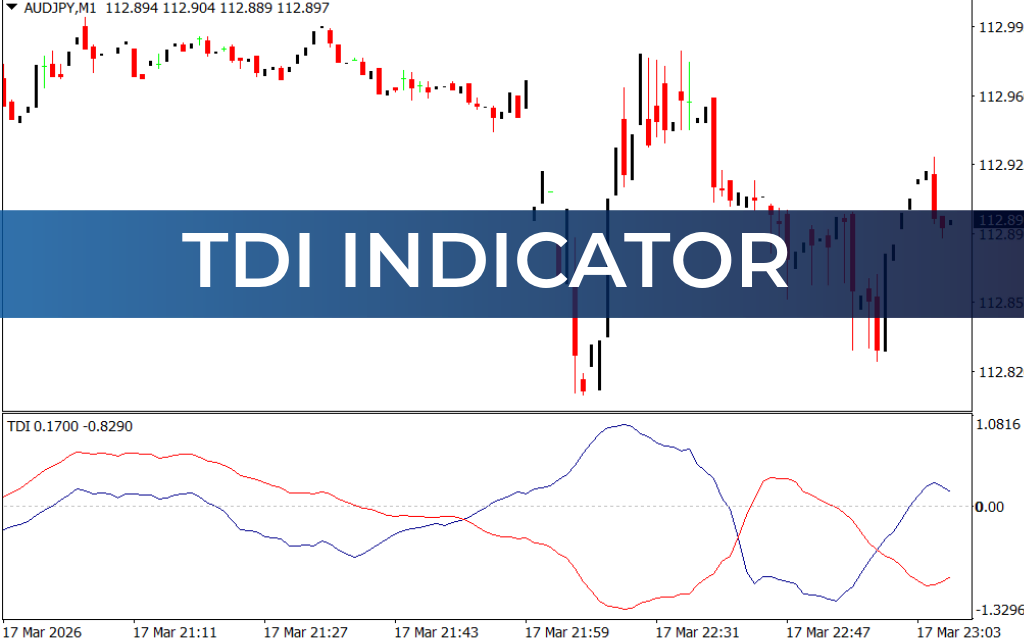
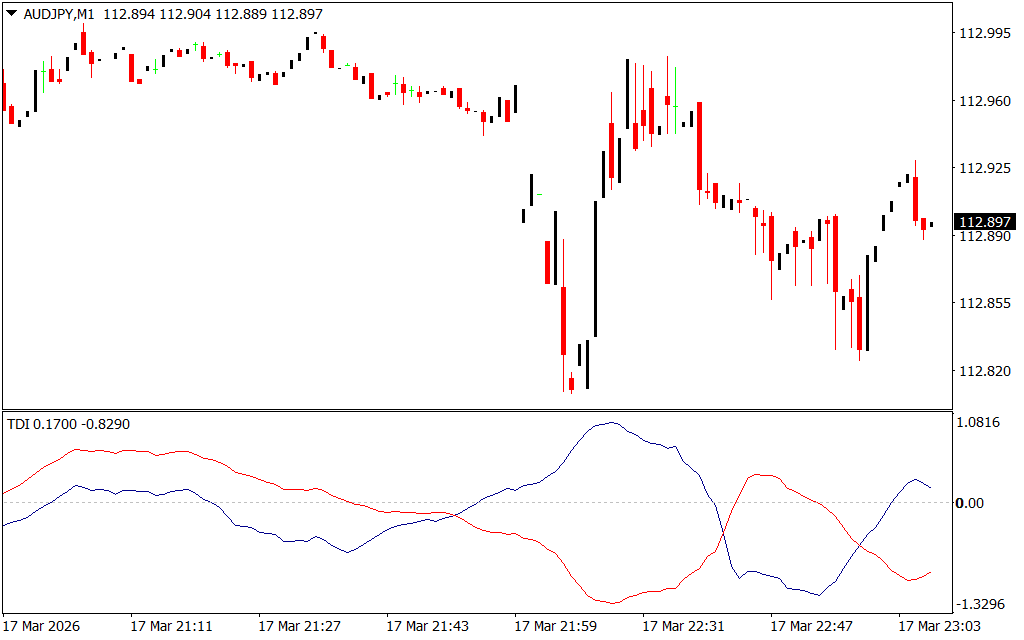
The TDI indicator for MetaTrader 4 (MT4) appears in a separate window below the main price chart. It includes two primary lines:
- Blue Line (Fast Line): Represents the short-term RSI trend.
- Red Line (Signal Line): A smoothed version of the RSI calculated using a longer period.
These two lines measure market momentum and volatility. When they cross each other, traders often interpret the crossover as a potential trading signal.
In addition to the two RSI lines, the indicator includes three Bollinger Bands:
- Upper Band (Blue): Marks the 68 level – the overbought zone.
- Lower Band (Blue): Marks the 32 level – the oversold zone.
- Middle Line (Yellow): The market baseline that helps identify trend direction.
When the indicator moves above 68, the market may be overbought, while movement below 32 suggests oversold conditions that could lead to a reversal.
TDI Trading Signals
One of the main advantages of the TDI indicator is its clear crossover signals.
Buy Signal
A buy signal occurs when:
- The blue line crosses above the red line from below.
This crossover indicates increasing bullish momentum and a possible upward move in price.
Sell Signal
A sell signal occurs when:
- The blue line crosses below the red line from above.
This suggests weakening momentum and a potential downward price movement.
Stronger Signals Using the Yellow Line
The yellow market baseline can help confirm the strength of a signal.
- If the red line crosses the yellow line from below, it indicates strengthening bullish momentum, supporting buy trades.
- If the red line crosses the yellow line from above, it signals bearish pressure, supporting sell positions.
The yellow line also interacts with key levels 50, 32, and 68, providing additional signals for potential market reversals.
Exit Strategy
A proper exit strategy helps protect profits and reduce risk.
For Buy Trades
Consider closing the position when:
- Price reaches the next resistance level, or
- The blue line crosses below the red line.
For Sell Trades
Close the trade when:
- Price reaches the next support level, or
- The blue line crosses above the red line.
Example of TDI in Action
For example, when analyzing GBP/JPY on a 5-minute chart, traders may notice:
- A sell signal when the green/blue line crosses the red line from above.
- A buy signal when the blue line crosses the red line from below, often followed by a price increase.
These signals help traders identify short-term momentum shifts in the market.
Conclusion
The Traders Dynamic Index (TDI) is a powerful technical indicator for identifying buy and sell opportunities. By combining RSI, Moving Averages, and Bollinger Bands into one tool, it provides traders with a comprehensive view of momentum, volatility, and trend direction.
While the indicator can be used as a stand-alone trading strategy, many traders achieve better results by combining it with price action, Support And Resistance levels, or other technical indicators to improve trade accuracy and risk management.
FAQ
Published:
Mar 17, 2026 18:09 PM
Category: