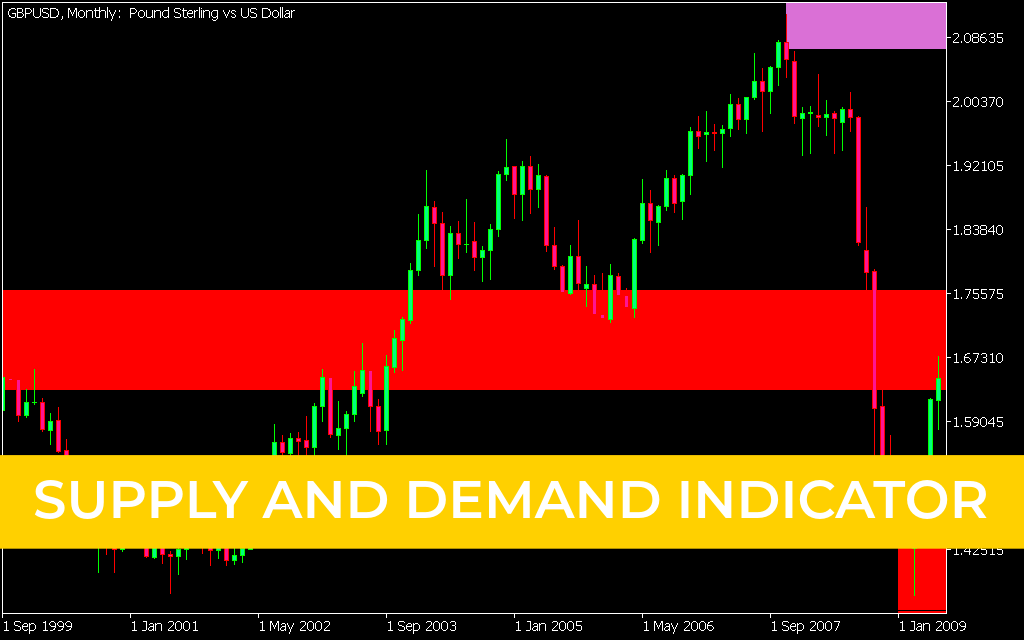
The Supply And Demand Indicator for MT5 is a powerful technical analysis tool that automatically draws supply and demand zones on your chart. These zones represent areas of strong buying (demand) or selling (supply) pressure, which often act as support and resistance levels.
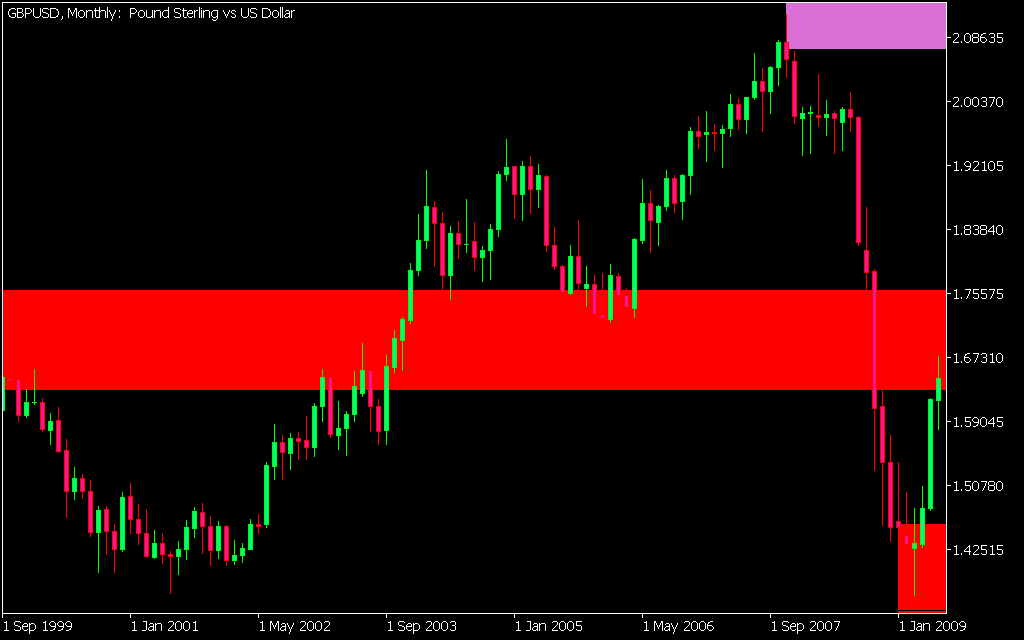
Since price tends to react to these zones even years after they form, the indicator saves traders the effort of manually plotting historical levels, making it especially useful for beginners who struggle to identify them.
Key Features
- Automatic Zone Detection: Accurately plots supply and demand zones on any currency pair.
- Color-Coded Zones:
- Green and red zones = tested and reliable (price has reacted at least twice).
- Sea green and orchid zones = potential areas to watch.
- Fibonacci Integration: Option to display Fibonacci retracements between zones for added confluence.
- Multi-Timeframe Support: Works on intraday, daily, weekly, and monthly charts.
- Beginner-Friendly: Simplifies support and resistance analysis.
How to Trade with Supply and Demand Indicator
- Sell on Supply: When price enters a supply zone, expect a downward bounce. Enter short trades with stop loss above the zone.
- Buy on Demand: When price enters a demand zone, expect an upward bounce. Enter long trades with stop loss below the zone.
- Zone Reliability: Focus on tested zones (green/red) for higher accuracy. Use untested zones (sea green/orchid) as potential watch areas.
- Confluence Strategy: Combine supply/demand zones with candlestick patterns or other indicators for stronger signals.
Who Should Use It?
- Beginners: Helps identify support and resistance zones without manual plotting.
- Intermediate Traders: Provides reliable tested zones for trend and reversal strategies.
- Advanced Traders: Can integrate ascending/descending channels, Fibonacci retracements, and Price Action for complex strategies.
Conclusion
The Supply and Demand Indicator for MT5 is a must-have tool for traders who rely on support and resistance. By automatically plotting zones and highlighting tested levels, it simplifies technical analysis and improves trading accuracy. Free to download and easy to install, it’s suitable for all trading styles and experience levels.
2 Downloads
Published:
Apr 12, 2026 06:45 AM
Category: