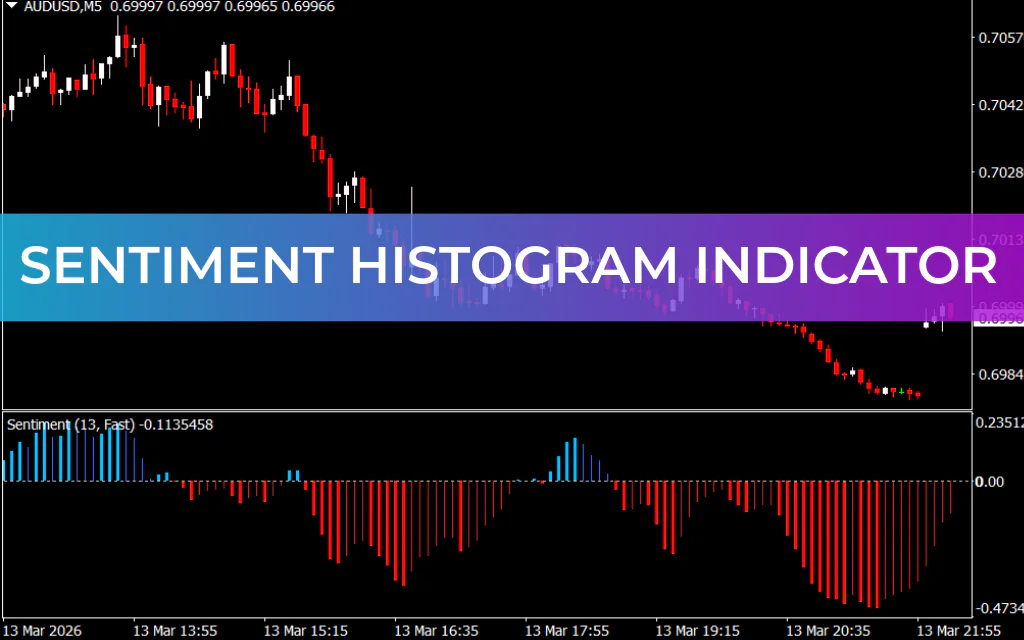
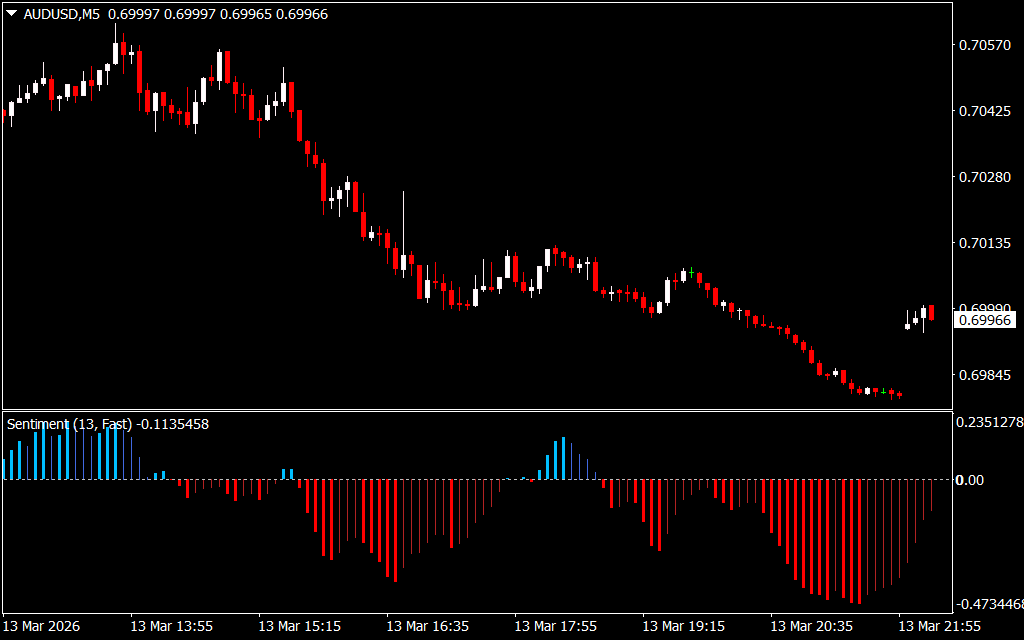
The Sentiment Histogram Indicator for MT4 is a powerful tool that visually displays BULLISH and BEARISH market conditions as colored histogram bars. It highlights both trend progression and retracements relative to a Zero line, helping forex traders identify BUY and SELL opportunities as well as early Trend Reversal signals.
Key Features
- Color-coded histogram –
- ROYAL BLUE: BULLISH trend progression
- Deep Sky Blue: BULLISH retracement
- FIRE BRICK: BEARISH trend progression
- RED: BEARISH retracement
- WHITE dotted line: Zero line for trend reference
- Trend visualization – The histogram shows the market sentiment, enabling traders to spot the strength of trends and potential reversals at a glance.
- BUY and SELL signals – The histogram automatically indicates trade opportunities based on trend direction relative to the Zero line.
- Multi-timeframe support (MTF) – Works on intraday, daily, weekly, and monthly charts. Traders can combine higher and lower timeframes for optimal entry points.
- Suitable for all traders – Beginners can easily follow the histogram’s color-coded signals, while advanced traders can integrate it with Price Action, other indicators, or EAs for automatic trading.
- Non-repainting – Signals remain fixed once the histogram bar is formed, giving reliable entry and exit cues.
How to Trade Using the Sentiment Histogram Indicator
Bullish Trades
- Look for ROYAL BLUE bars above the Zero line – indicates a strong BULLISH trend.
- Enter a BUY trade.
- Place Stop Loss below the previous swing low.
- Exit when:
- The histogram shows retracement (Deep Sky Blue)
- Opposite signal appears (BEARISH trend)
- Desired risk-reward ratio is achieved
Bearish Trades
- Look for FIRE BRICK bars below the Zero line – indicates a strong BEARISH trend.
- Enter a SELL trade.
- Place Stop Loss above the previous swing high.
- Exit when:
- Histogram retracement appears (RED)
- Opposite signal emerges (BULLISH trend)
- Target risk-reward ratio is achieved
Multi-Timeframe Strategy
- Use higher timeframe trends for overall market direction.
- Use lower timeframe histogram bars for precise entry and exit.
- This combination increases probability and reduces risk.
Pros and Cons
✅ Pros
- Clear visual representation of trend direction and strength.
- Highlights trend progression and retracements for better exit planning.
- Non-repainting and reliable signals.
- Suitable for manual or automated trading (EAs).
- Free to download and easy to install.
❌ Cons
- May produce minor false signals during highly volatile or choppy markets.
- Works best when used in combination with other trend-following indicators or price action.
Conclusion
The Sentiment Histogram Indicator for MT4 is an excellent tool for identifying market sentiment and planning trade entries and exits. Its color-coded histogram provides intuitive BUY/SELL signals and highlights trend progression and retracements, making it suitable for both new and experienced traders. By combining it with multi-timeframe analysis or other trend-following indicators, traders can significantly improve trading accuracy.
This indicator is free to download, easy to install, and works across all timeframes, making it a versatile addition to any MT4 trading setup.
FAQ
Published:
Mar 15, 2026 19:18 PM
Category: