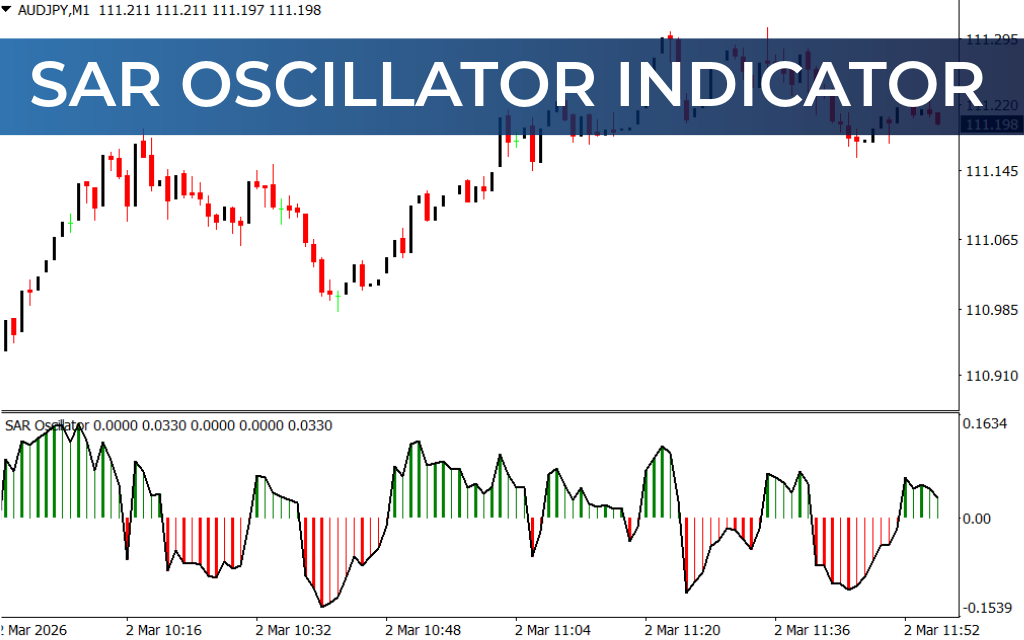
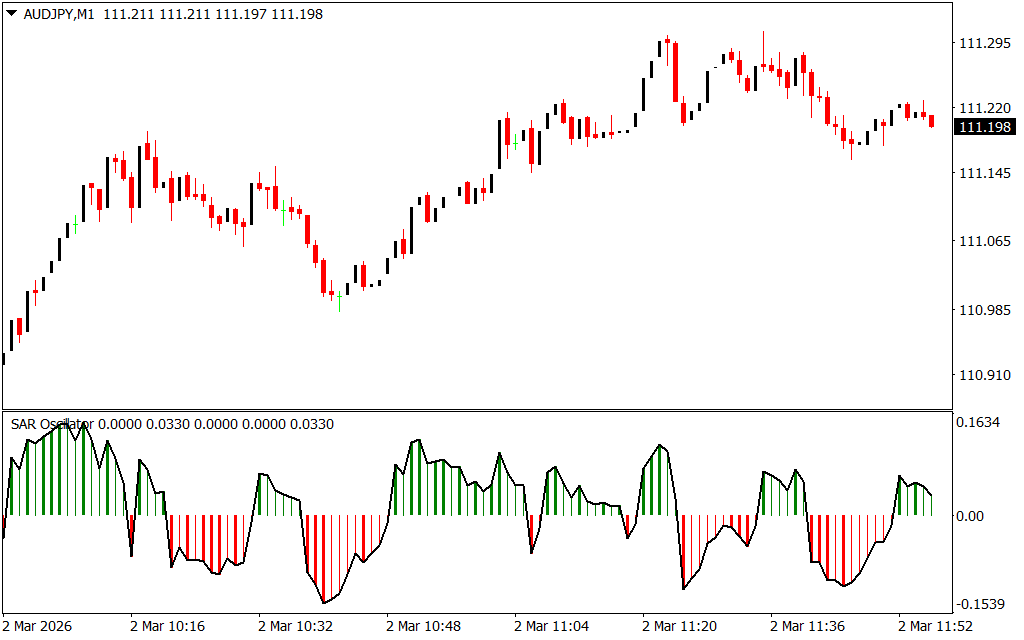
The SAR Oscillator Indicator for MetaTrader 4 is an advanced version of the classic Parabolic SAR. Unlike the traditional SAR that plots dots directly on the price chart, this upgraded oscillator displays color-coded histogram bars below the chart, offering clearer and more structured trend analysis.
By transforming SAR signals into an oscillator format, traders can quickly identify trend direction, momentum shifts, and potential reversals with greater visual clarity.
What Makes the SAR Oscillator Different?
The standard Parabolic SAR prints dots above or below price to indicate trend direction. While effective, it can sometimes clutter the main chart and make trend flow harder to interpret.
The SAR Oscillator improves usability by:
- Displaying histogram bars instead of chart dots
- Clearly separating bullish and bearish phases
- Using a zero line to define trend shifts
- Providing cleaner visual Trend Confirmation
This design makes it easier for traders to follow market momentum and anticipate directional changes.
How the SAR Oscillator Works
The indicator generates histogram bars below the chart:
- Green bars above the zero line – Bullish trend
- Red bars below the zero line – Bearish trend
A crossover of the zero level signals a potential Trend Reversal or the beginning of a new market phase.
However, the SAR Oscillator performs best in established trending markets, where it can effectively confirm continuation after retracements.
How to Use the SAR Oscillator for MT4
Bullish Setup
- The histogram turns green and moves above the zero line.
- This confirms bullish market direction.
- Wait for a minor pullback.
- Enter a buy trade when bullish momentum resumes.
- Place stop loss below the recent swing low.
Bearish Setup
- The histogram turns red and moves below the zero line.
- This confirms bearish market direction.
- Wait for a minor retracement upward.
- Enter a sell trade when bearish momentum resumes.
- Place stop loss above the recent swing high.
Trade Confirmation Tips
For stronger setups, combine the SAR Oscillator with:
- Price Action patterns (engulfing candles, pin bars)
- Support And Resistance levels
- Trendline breakouts
- Additional momentum indicators
This multi-confirmation approach improves trade accuracy and reduces false signals.
Why Traders Prefer the SAR Oscillator
- Clear histogram-based trend visualization
- Easier to interpret than traditional SAR dots
- Ideal for Scalping, intraday, and swing trading
- Works across multiple timeframes
- Helps identify trend continuation zones
The oscillator format simplifies decision-making and allows traders to quickly assess whether market momentum supports a trade.
Conclusion
The SAR Oscillator Indicator for MetaTrader 4 enhances the traditional Parabolic SAR by presenting signals in a histogram format below the chart. It clearly defines bullish and bearish phases using a zero-line structure, making trend detection more intuitive and actionable.
For traders seeking improved trend clarity and better retracement entries, this MT4 indicator is a practical and powerful addition to any trading strategy.
FAQ
8 Downloads
Published:
Mar 02, 2026 05:57 AM
Category: