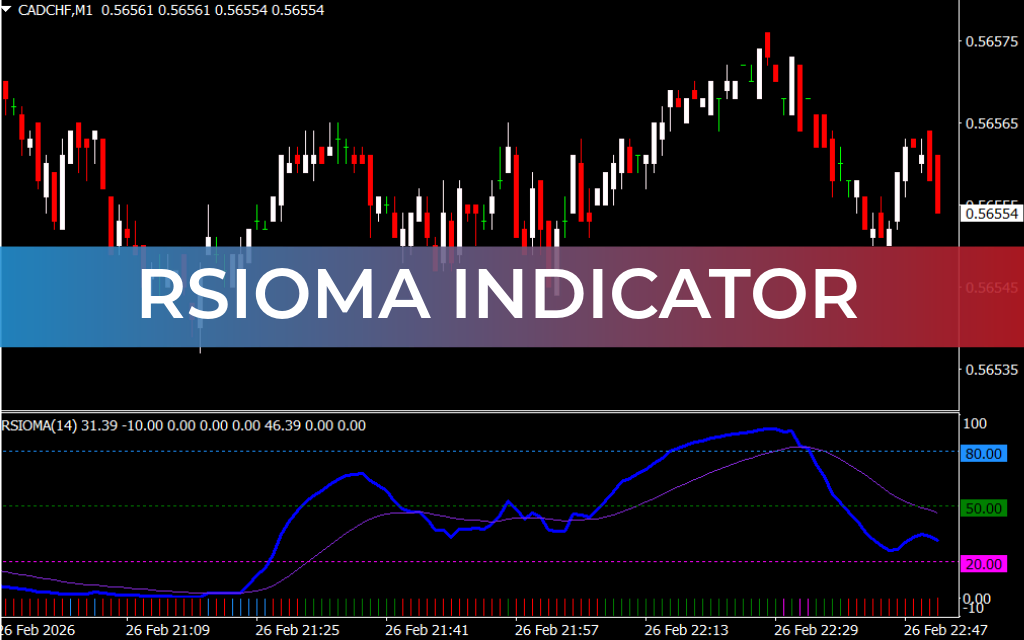
The RSIOMA (Relative Strength Index of Moving Averages) is an advanced variant of the classic RSI indicator. It combines moving averages with the RSI to produce smoother, more reliable bullish and bearish forex trend signals. Alerts are also provided, making it easier for traders to enter and exit trades on time.
This indicator is suitable for both new and experienced traders and works on all intraday and higher timeframe charts, making it versatile for Scalping, swing trading, and long-term strategies.
How It Works
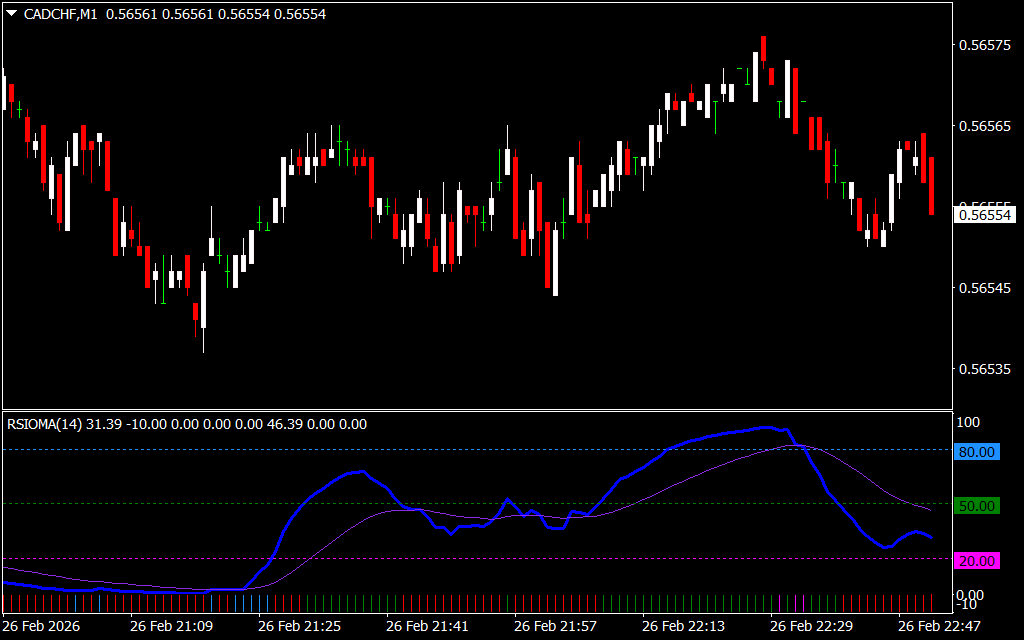
- Lines plotted:
- Blue line: RSI value
- Violet line: Moving average of the RSI
- Levels: 20, 50, 80 for identifying overbought, oversold, and trend zones
- Histogram bars: Show trend direction at a glance
Trading Strategies
- Midline (50) Break Strategy:
- Buy signal: RSIOMA rises above 50 → place stop below previous swing low
- Sell signal: RSIOMA crosses below 50 → place stop above previous swing high
- Overbought/Oversold Levels:
- Buy signal: Price rises above 20 level (oversold recovery)
- Sell signal: Price falls below 80 level (overbought reversal)
- Note: In strong trends, RSIOMA may remain above 80 or below 20 for extended periods
- Trend Confirmation:
- Use histogram bars and the moving average line to confirm Trend Strength before entering trades
Benefits & Features
✔ Smooths RSI signals with moving averages for reduced noise
✔ Provides clear bullish and bearish trend alerts
✔ Useful for all timeframes: intraday, daily, weekly, monthly
✔ Helps identify trend direction, momentum, and entry points
✔ Suitable for short-term and long-term trading strategies
✔ Alerts improve timely decision-making
Conclusion
The RSIOMA indicator for MT4 is a powerful enhancement of the classic RSI, combining moving averages to provide clear trend direction and trading alerts. It is ideal for traders looking to identify price trends, reduce false signals, and trade efficiently across multiple timeframes.
FAQ
1 Download
Published:
Feb 26, 2026 16:53 PM
Category: