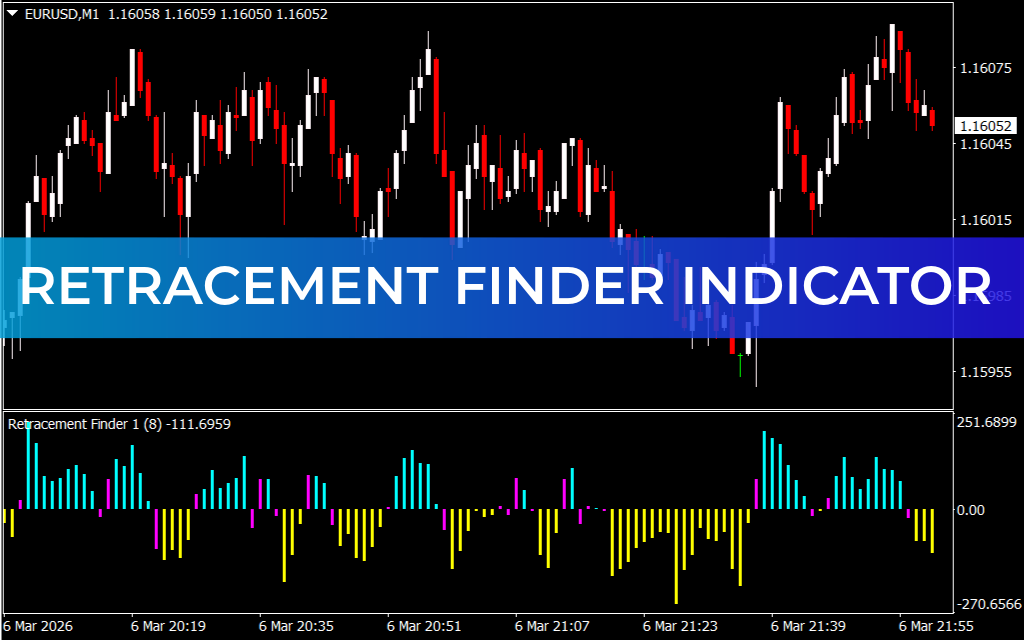
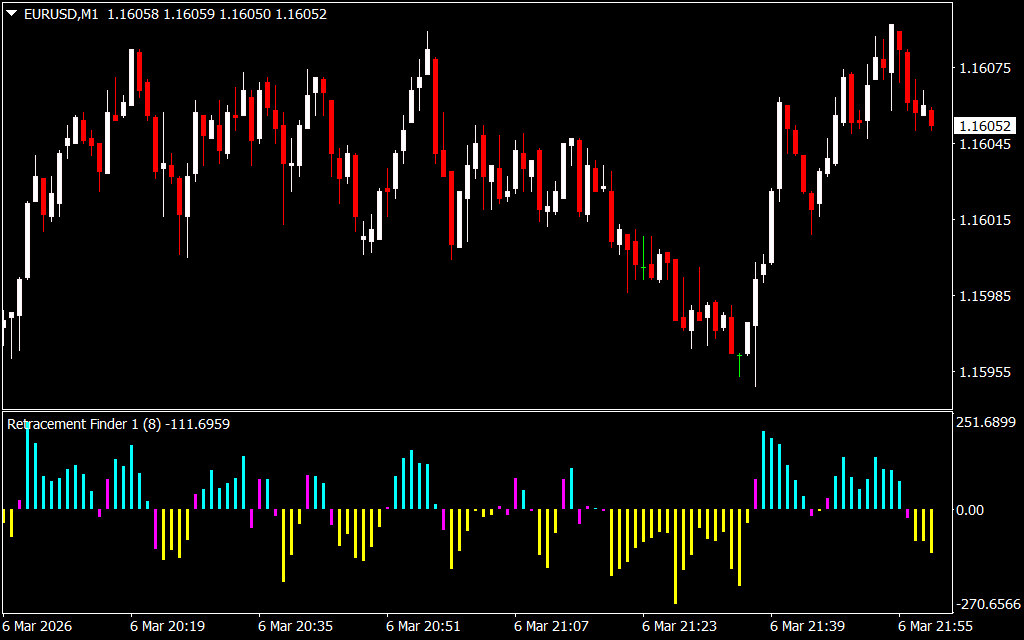
The Retracement Finder Indicator for MT4 is a simple technical tool designed to help traders identify market retracements and potential trend reversals. A retracement occurs when price temporarily moves against the main trend after a strong upward or downward move.
This indicator analyzes price behavior and displays colored bars relative to a central zero line, helping traders quickly identify when a trend may reverse or continue. It is commonly used on the MetaTrader 4 platform by traders who want an easy visual method to track market momentum.
How the Retracement Finder Indicator Works
The indicator has two main components:
1. Zero Line
The zero line acts as the center reference point. When bars appear above or below this line, they indicate changes in market momentum and possible retracement opportunities.
2. Colored Bars
The indicator uses three different colors to represent market conditions:
- Aqua Bars → Indicate a bullish trend or the start of an upward move
- Yellow Bars → Indicate a bearish trend or the start of a downward move
- Magenta Bars → Indicate strong market momentum (either bullish or bearish)
These bars help traders identify trend direction, reversals, and continuation signals.
Example Trading Setup
Consider a scenario on the **USD/JPY currency pair on the H4 timeframe.
Bullish Setup
- The market is previously in a downtrend.
- Aqua bars appear, indicating that bearish momentum is weakening.
- Traders anticipate a bullish reversal and look for buy opportunities.
Bearish Setup
- The market is previously in an uptrend.
- Yellow bars appear, showing that buyers are losing strength.
- Traders can anticipate a bearish reversal and consider sell positions.
Understanding Magenta Bars
Magenta bars represent strong market momentum.
These often appear when:
- Major economic news events occur
- Market volatility increases
- A strong trend acceleration happens
Although they signal strong momentum, many traders prefer to avoid entering trades during magenta bars and instead wait for confirmation after volatility stabilizes.
Important Trading Tips
During market consolidation, the indicator may switch frequently between yellow and aqua bars.
This usually happens when:
- Traders are uncertain about market direction
- A major news event is approaching
- The market is moving sideways
In such situations, relying solely on the indicator may produce false signals.
Best Confirmation Indicators
To improve accuracy, combine the Retracement Finder Indicator with:
- Relative Strength Index (RSI)
- MACD
- Stochastic Oscillator
- Support And Resistance analysis
These additional tools help confirm whether a retracement will turn into a full reversal or simply continue the trend.
Best Timeframes to Use
Although the indicator works on all timeframes, it performs best on higher timeframes, such as:
- H1
- H4
- Daily
Higher timeframes help reduce market noise and allow traders to identify larger and more reliable reversals.
Key Features of the Retracement Finder Indicator
- Identifies market retracements and reversals
- Uses color-coded bars for trend signals
- Includes a central zero line for momentum analysis
- Works on all timeframes
- Helps detect trend continuation and momentum shifts
- Suitable for Scalping, day trading, and swing trading
- Beginner-friendly visual indicator
Conclusion
The Retracement Finder Indicator for MT4 is a simple yet powerful tool that helps traders identify trend reversals, retracements, and momentum changes using color-coded bars. By analyzing the appearance of aqua, yellow, and magenta bars, traders can better understand when a market trend may shift or continue.
When combined with Price Action and momentum indicators, it becomes a valuable tool for improving trade timing and trend analysis.
FAQ
Published:
Mar 06, 2026 16:12 PM
Category: