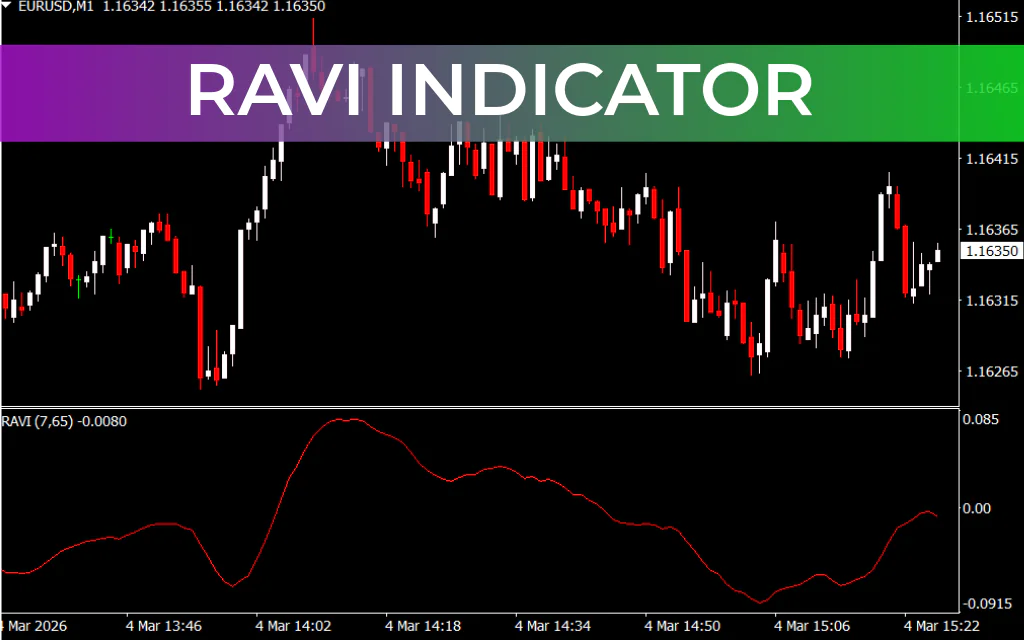
The Ravi Indicator is a trend-following MT4 tool that tracks Price Action to help traders identify market direction and potential reversals. Its core feature is the zero line, which acts as a key reference point for spotting trend changes and momentum exhaustion.
How the Ravi Indicator Works
The most important aspect of the Ravi Indicator is the zero-line crossover:
- Signal line above zero – indicates a potential uptrend and a buy opportunity.
- Signal line below zero – indicates a potential downtrend and a sell opportunity.
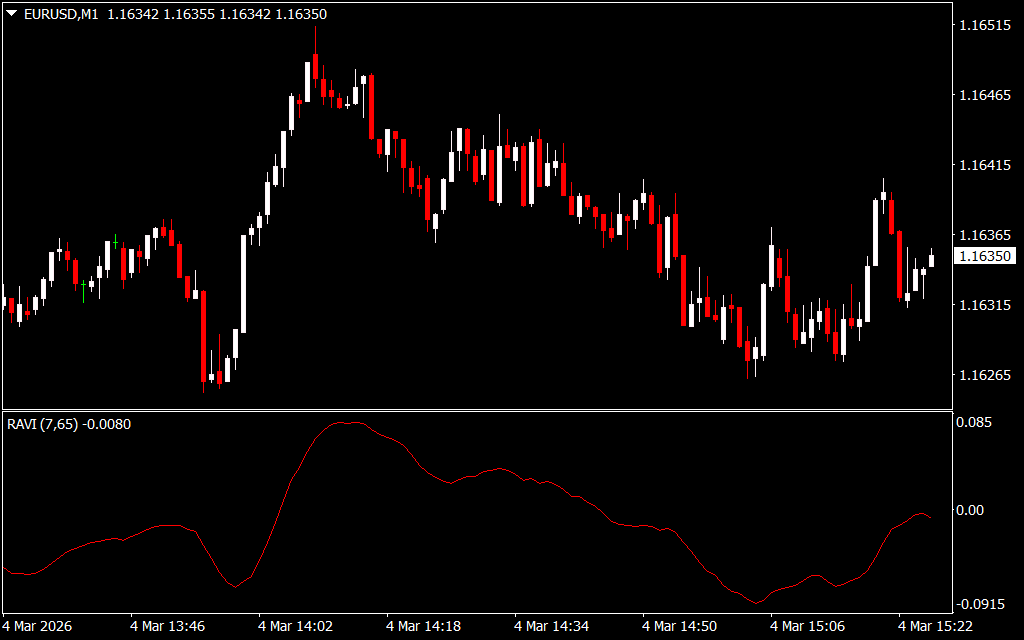
Additionally, the indicator can highlight overbought or oversold conditions:
- Signal line at the top – suggests bullish exhaustion and a potential bearish reversal.
- Signal line at the bottom – indicates bearish exhaustion and a potential bullish reversal.
These features make the Ravi Indicator similar to momentum oscillators such as RSI, MACD, and Stochastic Oscillators, allowing traders to anticipate trend reversals.
How to Use the Ravi Indicator
- Trend Identification:
- Use zero-line crossovers to determine buy or sell opportunities.
- Reversal Signals:
- Monitor when the signal line reaches extreme highs or lows to anticipate potential market reversals.
- Timeframe Considerations:
- While the indicator works on all timeframes, longer timeframes are recommended to reduce false signals.
Conclusion
The Ravi Indicator for MT4 is a versatile tool for identifying trend direction, potential reversals, and overbought/oversold conditions. It is easy to use and can complement other technical indicators for better trading accuracy. You can download the Ravi Indicator for free and start improving your MT4 trading strategy today.
FAQ
Published:
Mar 04, 2026 09:28 AM
Category: