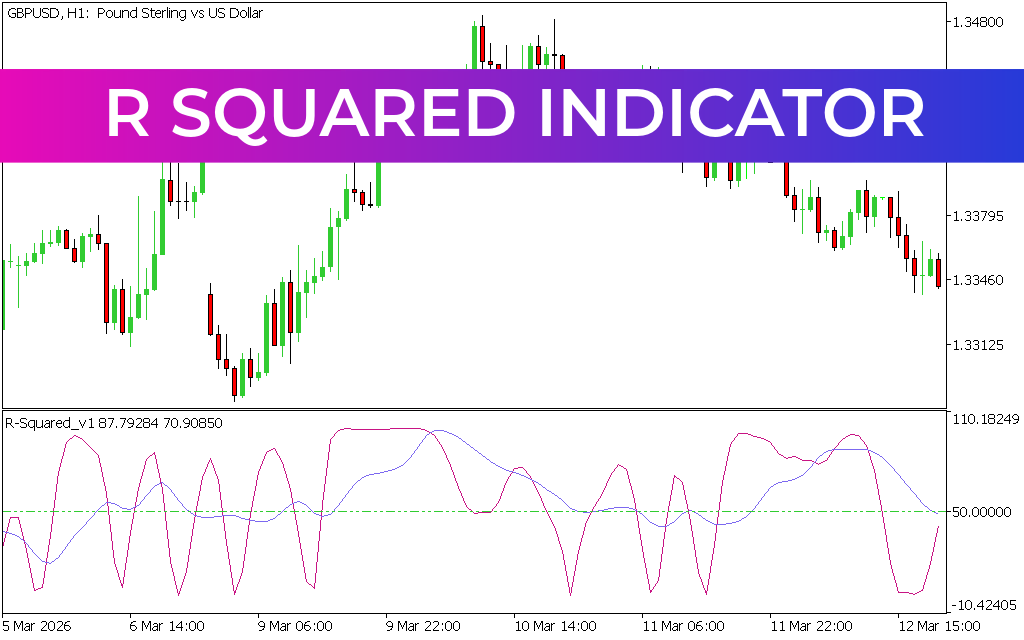
The R Squared Indicator for MT5 is a simple yet effective oscillator that helps forex traders identify overbought and oversold market conditions. Belonging to the family of oscillators, it works similarly to RSI or Stochastic, fluctuating between 0 and 101 with two signal lines that measure trend direction.
Key Features
- Oscillator Range: Moves between 0 and 101 to highlight market extremes.
- Signal Lines: Two lines with equal length and smoothness for trend direction.
- Multi-Timeframe Support: Can be applied to any chart, though longer timeframes provide more reliable signals.
- Versatility: Works best when combined with other indicators such as Moving Averages or RSI to filter false signals.
Trading Signals
- Overbought Condition (Near 101): Indicates potential market exhaustion. Traders can enter short positions or exit long trades.
- Oversold Condition (Near 0): Suggests market weakness. Traders can go long or close short positions.
- Confirmation with Other Tools: Pairing R Squared with MA or RSI improves accuracy and reduces false signals.
Practical Example
On the EUR/USD H4 chart, the R Squared Indicator highlights BUY signals when the line approaches oversold levels and SELL signals when it nears overbought levels. This makes it a straightforward tool for identifying reversal opportunities.
Conclusion
The R Squared Indicator for MT5 is a momentum oscillator that provides clear insights into overbought and oversold levels. While simple to use, it is most effective when combined with other technical indicators for confirmation. Traders can download the indicator for free and integrate it into their MT5 platform to enhance trading strategies.
1 Download
Published:
Apr 12, 2026 04:14 AM
Category: