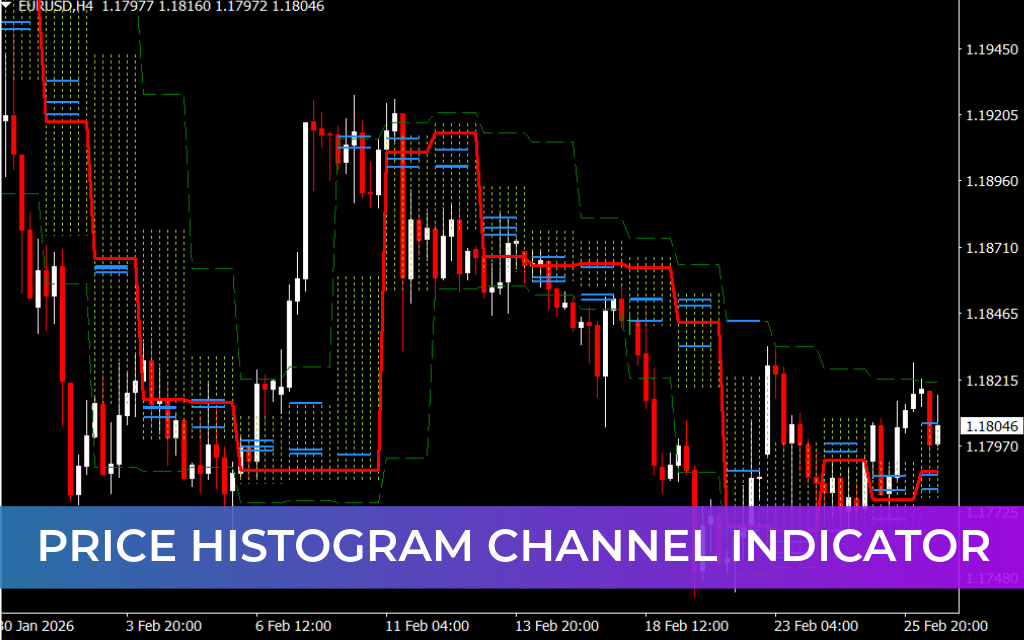
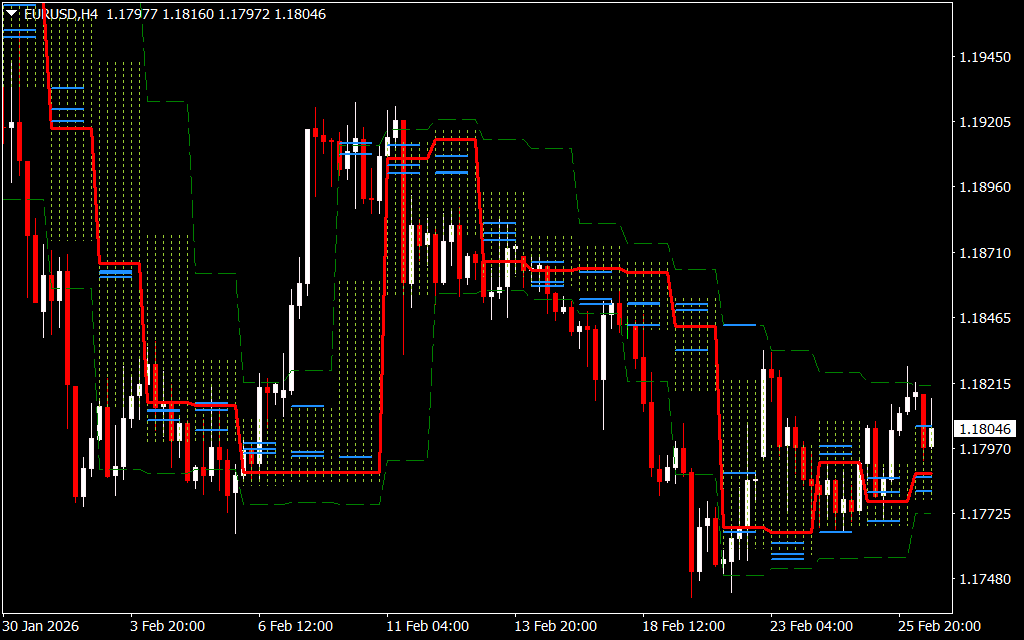
The Price Histogram Channel Indicator for MT4 is a versatile trading tool that plots a price channel based on higher-timeframe data, combined with histogram analysis of trading activity. Designed for the MetaTrader 4, this indicator provides clear Support And Resistance levels while allowing traders to pinpoint entries on lower timeframes with precision.
By combining H4 price data with intraday activity, the Price Histogram Channel helps traders identify extreme price conditions, trend reversals, and optimal breakout points. It is suitable for both beginner and advanced Forex traders focusing on intraday and short-term trading.
How the Price Histogram Channel Indicator Works
The indicator visually plots the following elements:
- Red Line – Top of the histogram, indicating extreme price levels
- Blue Lines – Support and resistance levels for intraday trades
- Dot Area – Represents where 60% of trades occur
- Dash Area – Represents where 90% of trades occur
Trading Insights:
- Price above the red line signals bullish conditions
- Price below the red line signals bearish conditions
- Extreme price conditions near the histogram edges often precede reversals
These features allow traders to monitor where most market activity occurs and identify potential reversal or breakout points.
Price Histogram Channel Trading Strategy
Bullish Strategy
- Enter buy trades when price breaches the red line upward or reverses near lower extremes
- Place stop loss below the previous swing low
- Take profit at the next opposite signal or resistance level
Bearish Strategy
- Enter sell trades when price moves below the red line or reverses near upper extremes
- Place stop loss above the previous swing high
- Take profit at the next opposite signal or support level
Support and Resistance Lines:
The blue lines act as dynamic intraday reference points, helping traders identify potential entry and exit levels based on price activity.
Key Features and Benefits
1. Higher-Timeframe Analysis
H4 price data visible on all lower timeframes for precise entries.
2. Intraday Trading Focus
Optimized for short-term and intraday strategies.
3. Histogram-Based Insights
Visualizes where most trades occur to anticipate reversals and trend continuation.
4. Clear Support & Resistance Levels
Blue lines provide actionable intraday entry and exit points.
5. Beginner and Advanced Friendly
Simple visualization with actionable trading signals.
Why Use the Price Histogram Channel Indicator for MT4?
This indicator allows traders to combine higher-timeframe trend awareness with lower-timeframe precision. By analyzing both price extremes and trading volume, traders can improve timing for entries, exits, and reversal opportunities. Its clear visual cues reduce guesswork and help traders stay aligned with market momentum.
Conclusion
The Price Histogram Channel Indicator for MT4 provides a reliable framework for trading based on price extremes and market activity. By highlighting bullish, bearish, and neutral zones, along with support and resistance levels, it equips traders with actionable insights for intraday trading. Download the Price Histogram Channel Indicator today to enhance your precision in short-term Forex trading.
FAQ
2 Downloads
Published:
Feb 26, 2026 09:21 AM
Category: