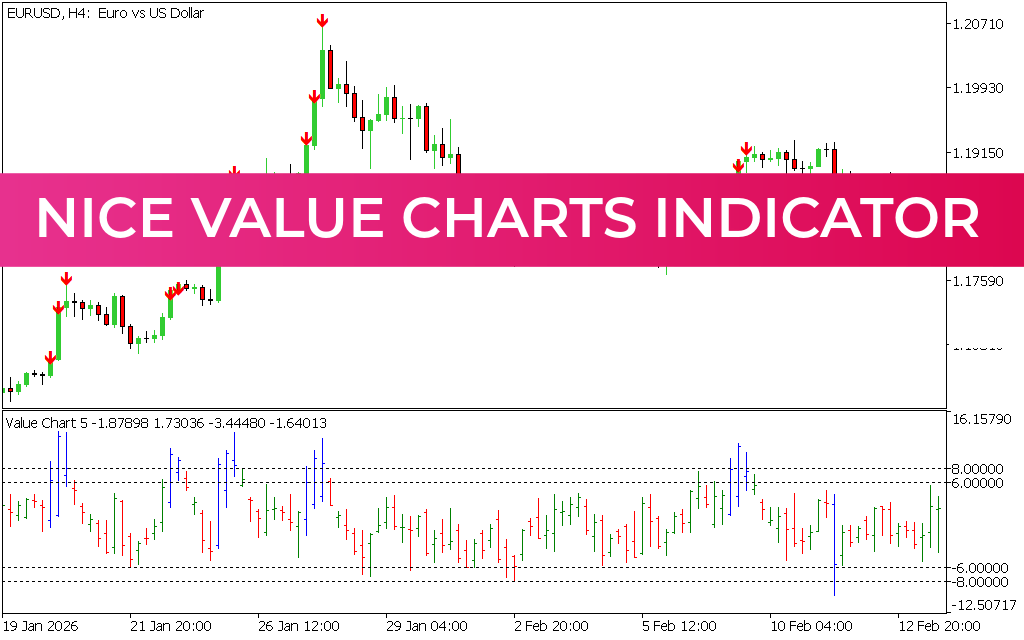
The Nice Value Charts Indicator for MT5 is a technical oscillator designed to help traders identify overbought and oversold market conditions. Unlike traditional oscillators, it presents market momentum in a visually intuitive and easy-to-read format, making it suitable for both beginner and advanced forex traders.
This indicator helps traders spot potential reversal zones where price may be stretched too far in either direction.
Key Features of Nice Value Charts Indicator
- Automatically detects overbought and oversold conditions
- Oscillates around a central zero level
- Color-coded bars for easy signal recognition
- Helps identify potential market reversal zones
- Works on all forex pairs and timeframes
When the indicator moves above or below key thresholds, it visually changes color, making trading signals easier to interpret.
How the Nice Value Charts Indicator Works
The indicator fluctuates around a neutral zero line:
- When values rise above the overbought zone, the bars typically turn green, signaling a potential sell opportunity
- When values fall below the oversold zone, the bars turn red, signaling a potential buy opportunity
These signals are based on the assumption that price tends to revert after reaching extreme levels.
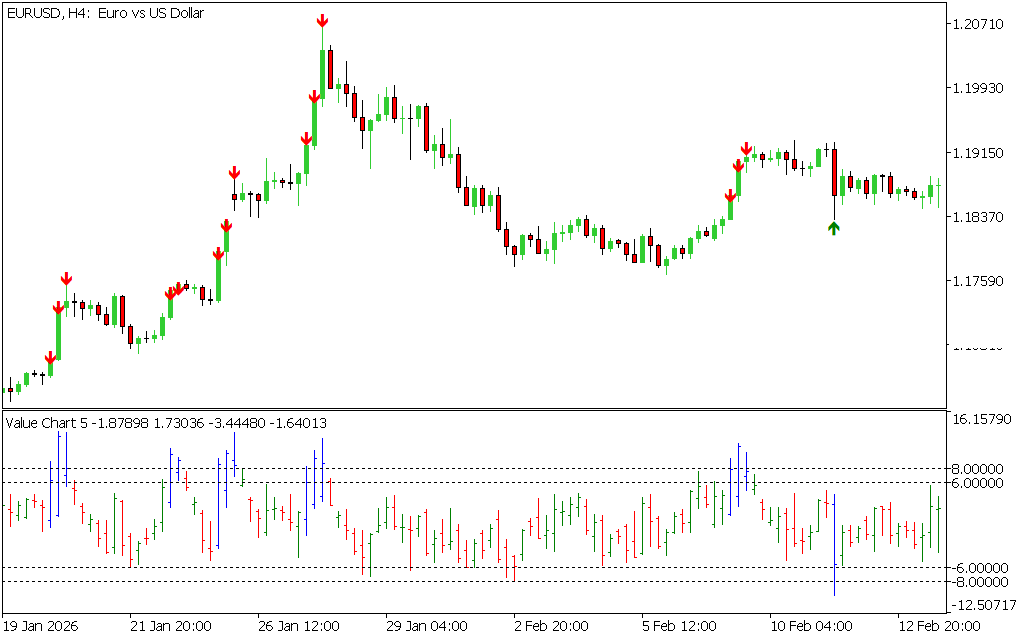
How to Trade Using Nice Value Charts
Sell Signal (Overbought Zone)
A sell setup occurs when:
- The market is in a bearish or weakening trend
- The indicator enters the overbought zone
- Price begins to turn downward (confirmation required)
Entry: Open a short position after bearish confirmation (e.g., break below previous candle low)
Stop Loss: Above the overbought signal candle
Exit: At support levels, or when a reversal or bullish signal appears
Buy Signal (Oversold Zone)
A buy setup occurs when:
- Price is near a support level
- The indicator enters the oversold zone
- Bullish Price Action confirms reversal
Entry: Open a long position after bullish confirmation
Stop Loss: Below the oversold signal candle
Exit: At resistance levels or when a bearish reversal signal appears
Signal Accuracy and Limitations
Like most oscillators, the Nice Value Charts Indicator can produce false signals if used alone.
Common issues include:
- Overbought signals during strong uptrends
- Oversold signals during strong downtrends
- Premature reversal expectations
To improve accuracy, traders should combine it with:
- Support and resistance levels
- Price action patterns (engulfing, pin bars, doji)
- Trend indicators or moving averages
This helps filter weak signals and increases trade reliability.
Risk Management Strategy
For better trading results:
- Always wait for confirmation before entering trades
- Use stop-loss above/below signal candles
- Apply trailing stops to protect profits in trending markets
- Avoid trading against strong trends without confirmation
Best Use Cases
The Nice Value Charts Indicator performs best when:
- Market is ranging or consolidating
- Clear support and resistance zones are visible
- Combined with other technical indicators
It is less effective during strong trending markets unless used with trend filters.
Conclusion
The Nice Value Charts Indicator for MT5 is a visually appealing and useful oscillator that helps traders identify overbought and oversold conditions with ease. While it can highlight potential reversal zones effectively, its accuracy improves significantly when combined with price action and additional technical analysis tools.
Used correctly, it can help traders capture market reversals and improve entry timing for both buy and sell trades.
3 Downloads
Published:
Apr 13, 2026 08:21 AM
Category: