My Price Action Indicator for MT4 – Effortlessly Identify Key Price Movements
Are you a price action trader struggling to spot valid candlestick patterns quickly? The My Price Action Indicator for MT4 makes this task simple by highlighting important candlesticks where significant price changes are likely to occur.
What is the My Price Action Indicator?
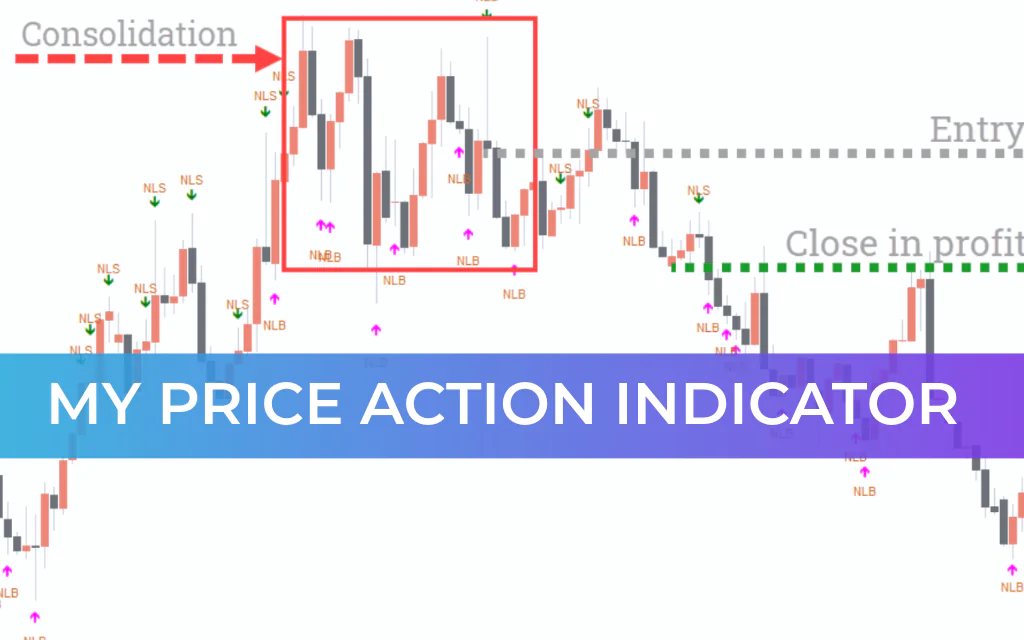
This custom MT4 indicator identifies key candlesticks by marking them with arrows above or below the candles. The color of the arrows indicates potential buying or selling pressure:
Pink Arrow Below (NLB) – Indicates potential buying opportunity
Green Arrow Above (NLS) – Indicates potential selling opportunity
Note: Arrow indications are not standalone buy or sell signals. Understanding their context and combining them with other tools is essential for effective trading.
The indicator primarily analyzes the shadows (wicks) of candlesticks:
A long lower shadow suggests increasing buying pressure → potential long trade
A long upper shadow suggests increasing selling pressure → potential short trade
How to Use the Indicator
The indicator works best on a 4-hour timeframe and helps identify price consolidation zones, making it easier to spot buying or selling pressure.
Buy Setup:
Use a 4-hour timeframe.
Set hightwick1 = 50, hightwick2 = 25, lowtwick1 = 50, lowtwick2 = 25.
Identify price consolidation areas.
Look for a candle with a pink arrow below (NLB).
Enter a long position with stop-loss below the shadow.
Close the trade when a green arrow above (NLS) appears.
Sell Setup:
Use a 4-hour timeframe.
Set hightwick1 = 50, hightwick2 = 25, lowtwick1 = 50, lowtwick2 = 25.
Identify price consolidation areas.
Look for a candle with a green arrow above (NLS).
Enter a short position with stop-loss above the shadow.
Close the trade when a pink arrow below (NLB) appears.
Conclusion
The My Price Action Indicator reduces the effort needed to manually search for price action patterns and helps traders detect buying and selling pressure effectively. However, it should not be relied upon blindly. Combining this indicator with confirmatory tools and backtesting is essential before trading with a live account.
FAQ
3 Downloads
Published:
Feb 20, 2026 10:49 AM
Category: