The Multi Trend Signal Indicator for MT4 is a powerful technical tool that combines multiple popular indicators to help traders determine the overall market trend direction. Instead of relying on a single indicator, this tool analyzes several indicators simultaneously to provide a broader view of market conditions.
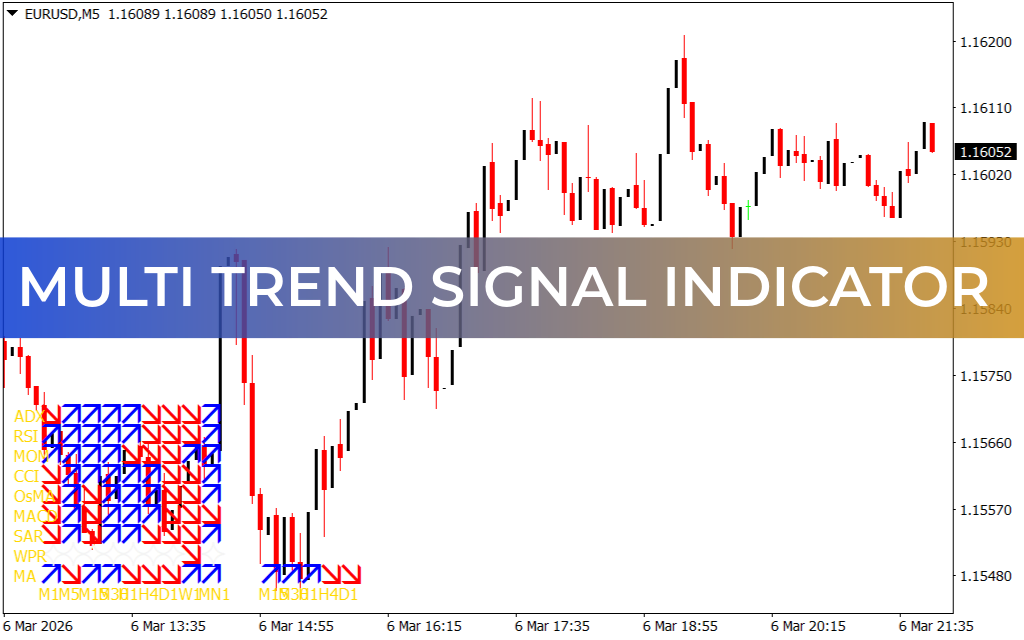
The indicator works on the MetaTrader 4 platform and displays blue and red arrows representing bullish and bearish trends.
- Blue Arrow → Indicates an uptrend
- Red Arrow → Indicates a downtrend
By combining signals from multiple indicators, traders can better understand Trend Strength and possible market direction.
Indicators Used in the Multi Trend Signal Indicator
The indicator analyzes nine well-known technical indicators, each contributing to the overall trend analysis:
- Average Directional Index (ADX)
- Relative Strength Index (RSI)
- Momentum Indicator (MOM)
- Commodity Channel Index (CCI)
- Moving Average of Oscillator (OsMA)
- MACD
- Parabolic SAR
- Williams %R (WPR)
- Moving Average (MA)
Most of these indicators are oscillators, which help identify overbought and oversold market conditions.
Multi-Timeframe Trend Analysis
One of the key advantages of this indicator is its multi-timeframe analysis.
It shows trend signals across different timeframes, including:
- 1 Minute
- 5 Minutes
- 15 Minutes
- 30 Minutes
- 1 Hour
- 4 Hours
- Daily
- Weekly
- Monthly
This allows traders to analyze short-term and long-term trends simultaneously, making it easier to align trades with the broader market direction.
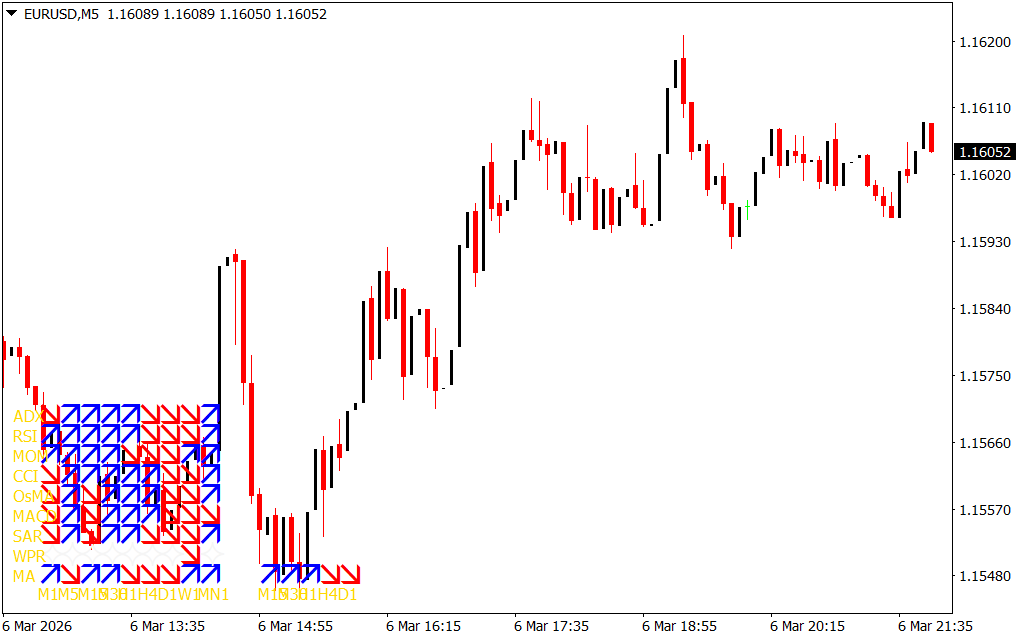
How to Use the Multi Trend Signal Indicator
The indicator does not directly give buy or sell signals. Instead, it helps traders determine the overall trend bias.
Bullish Scenario
- Most indicators display blue arrows.
- This indicates that multiple indicators confirm a bullish trend.
- Traders can start looking for buy opportunities.
Bearish Scenario
- Most indicators show red arrows.
- This suggests a bearish market direction.
- Traders may look for sell opportunities.
Example Trading Setup
Consider a trading setup on the **USD/JPY currency pair in the H4 timeframe.
- The indicator panel shows mostly blue arrows across several indicators.
- This suggests that the majority of indicators confirm a bullish trend.
- Traders can look for buy entries during pullbacks or support retests.
Similarly, if most arrows turn red, traders may look for sell opportunities.
Important Trading Tips
Although the Multi Trend Signal Indicator combines multiple indicators, it may still produce false signals.
For better results:
- Use Support And Resistance analysis
- Confirm signals with Price Action
- Look for trend continuation patterns
Combining these techniques helps traders improve trade accuracy and avoid weak signals.
Key Features of the Multi Trend Signal Indicator
- Combines nine popular technical indicators
- Provides multi-timeframe trend analysis
- Displays simple arrow-based trend signals
- Helps confirm market direction
- Works on all timeframes
- Suitable for Scalping, day trading, and swing trading
- Beginner-friendly visual indicator
Who Should Use This Indicator?
The Multi Trend Signal Indicator is useful for traders who prefer multi-indicator confirmation strategies.
It is commonly used by:
- Beginner traders learning trend analysis
- Day traders analyzing intraday market conditions
- Swing traders aligning trades with higher timeframe trends
Because it combines multiple indicators, it helps traders reduce reliance on a single signal source.
Conclusion
The Multi Trend Signal Indicator for MT4 is a powerful multi-indicator tool that combines nine technical indicators and multi-timeframe analysis to determine the overall trend direction. By analyzing multiple signals at once, traders gain a clearer understanding of market momentum and direction.
When used together with price action and proper risk management, it can become an effective tool for improving trend confirmation and trading decisions.
FAQ
Published:
Mar 06, 2026 16:21 PM
Category: