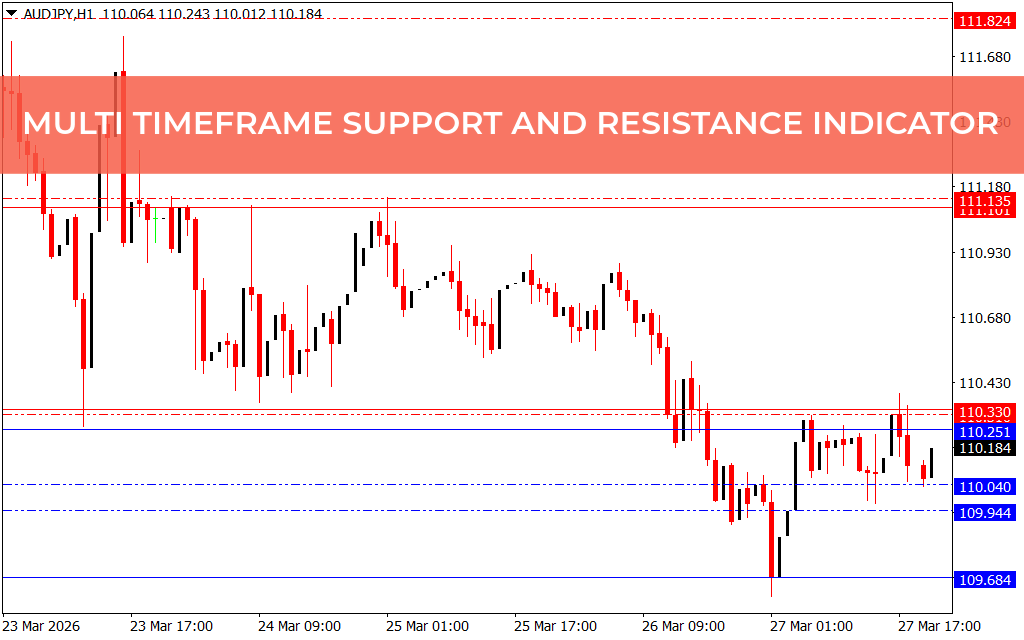
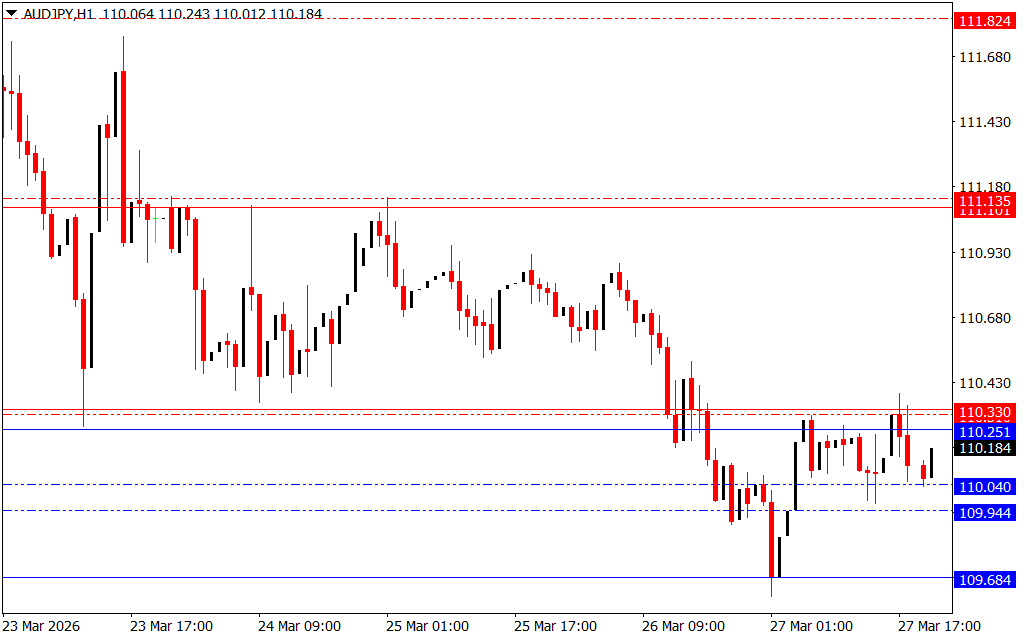
The Multi Timeframe Support And Resistance Indicator for MetaTrader 4 is a powerful analytical tool that automatically plots key support and resistance levels from multiple timeframes onto a single chart. These levels are critical in trading, as they represent zones where price is likely to reverse, consolidate, or break out.
By combining higher and lower timeframe levels, this indicator provides a complete Market Structure view, helping traders make more accurate and confident decisions.
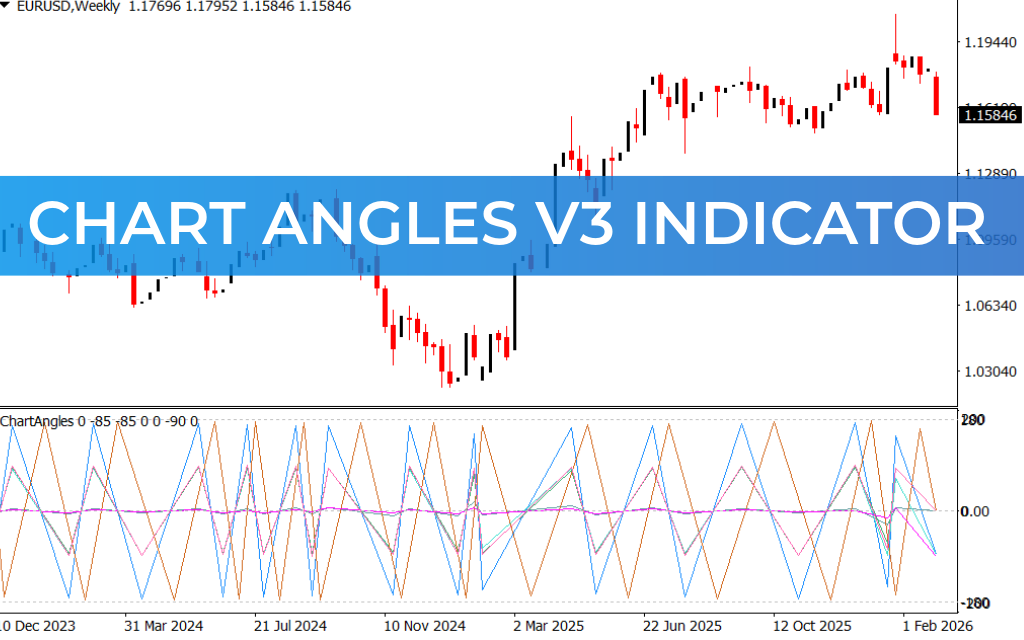
How the Indicator Works
The indicator identifies and displays support and resistance levels from different timeframes, such as:
- Higher Timeframes: Daily, Weekly, Monthly
- Lower Timeframes: H1, M30, M15
These levels are plotted simultaneously on your current chart, allowing you to see where price is most likely to react.
Trading Signals & Strategy
1. Support & Resistance Reactions
- At Resistance Levels:
- Price may reverse downward
- Or break out upward
- At Support Levels:
- Price may bounce upward
- Or break down further
2. Confluence Trading (High-Probability Setup)
- When multiple levels from different timeframes align → strong zone
- These areas often produce:
- Sharp reversals
- Strong breakouts
👉 The more timeframes agreeing, the stronger the level
3. Trend Trading with Level Flips
- In strong trends:
- Resistance becomes support (bullish continuation)
- Support becomes resistance (bearish continuation)
This creates powerful retest entry opportunities.
Key Benefits
- ✅ Combines multiple timeframes into one chart
- ✅ Highlights strong confluence zones
- ✅ Saves time (no manual level drawing)
- ✅ Works for Scalping, intraday, and swing trading
- ✅ Improves entry, exit, and stop-loss placement
Why It’s Powerful
Most traders lose because they focus on only one timeframe.
This indicator solves that by showing:
- Where big players (higher timeframe) are active
- Where short-term moves (lower timeframe) are happening
This gives you a complete picture of market structure.
Pro Trading Tips
- Always prioritize higher timeframe levels (stronger zones)
- Use lower timeframe levels for precise entries
- Wait for Price Action confirmation (don’t trade blindly)
- Combine with:
- Trend indicators
- Fibonacci levels
- Liquidity tools
Example Strategy (Simple & Effective)
- Identify trend direction on higher timeframe
- Wait for price to reach a multi-timeframe support/resistance zone
- Look for confirmation (rejection candles, break & retest)
- Enter trade with:
- Stop-loss beyond the zone
- Target next key level
Conclusion
The Multi Timeframe Support and Resistance Indicator for MT4 is an essential tool for traders who want to understand the market from a broader and more accurate perspective. By combining levels across multiple timeframes, it helps identify high-probability trading zones, improves timing, and enhances overall trading performance.
Whether you’re a beginner or an advanced trader, this indicator provides the clarity needed to trade with confidence and precision.
FAQ
3 Downloads
Published:
Mar 29, 2026 12:22 PM
Category: