The MTF Fractals Indicator for MetaTrader 4 is a powerful technical tool used to identify potential trend reversals, retracements, and the emergence of new trends. By displaying fractals from multiple timeframes directly on a single chart, the indicator allows traders to enter positions at more favorable price levels and capture strong market moves with improved precision.
One of its key advantages is that it works without repainting, making its signals more reliable for real-time trading decisions.
How the MTF Fractals Indicator Works
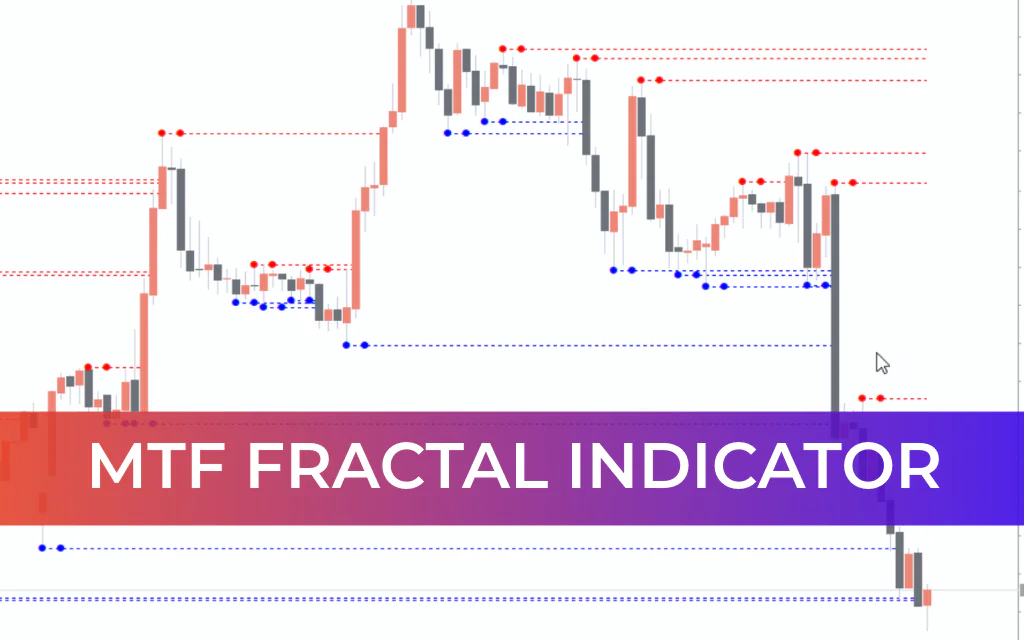
The MTF (Multi-Timeframe) Fractals Indicator overlays fractal levels from different timeframes onto one selected chart, eliminating the need to switch between multiple tabs.
Default Settings
Up Fractals → Highlighted in Blue
Down Fractals → Highlighted in Red
When you hover your cursor over a fractal line, the indicator displays:
The timeframe on which the fractal was formed
The exact price level
This makes it highly convenient for traders who incorporate fractal theory into their trading systems. Instead of analyzing each timeframe separately, traders can see complete structural information in one view.
The indicator can be used as:
A standalone trend structure tool
A confirmation element within an existing strategy
A Support And Resistance reference system
MTF Fractals Trading Strategy
Buy Setup
Identify an up fractal (blue line)
Wait for a bullish candle to close above the fractal support level
Place a Buy Stop order a few pips above the high of that candle
Set Stop Loss slightly below the fractal support
Take Profit options:
Close manually when a down fractal appears
Or set TP at the next horizontal resistance level
Sell Setup
Identify a down fractal (red line)
Wait for a bearish candle to close below the fractal resistance
Place a Sell Stop order slightly below the candle’s low
Set Stop Loss slightly above the fractal resistance
Take Profit options:
Close manually when an up fractal appears
Or set TP at the next horizontal support level
Why Traders Use MTF Fractals
Displays multiple timeframe fractals on one chart
Non-repainting signals
Identifies retracements and trend reversals
Highlights key support and resistance levels
Works on all timeframes
Enhances entry precision
By aligning fractals from higher timeframes with entry triggers on lower timeframes, traders can improve timing and reduce unnecessary risk exposure.
Final Verdict
The MTF Fractals Indicator for MT4 is a reliable trend structure and reversal detection tool suitable for traders of all experience levels. It simplifies multi-timeframe analysis and enhances trading precision by clearly marking key swing highs and lows.
However, like all technical indicators, it should not be used in isolation. Combining it with additional confirmation tools — such as trend indicators, momentum analysis, or Price Action techniques — can significantly improve trading performance and risk management.
FAQ
3 Downloads
Published:
Feb 19, 2026 12:32 PM
Category: