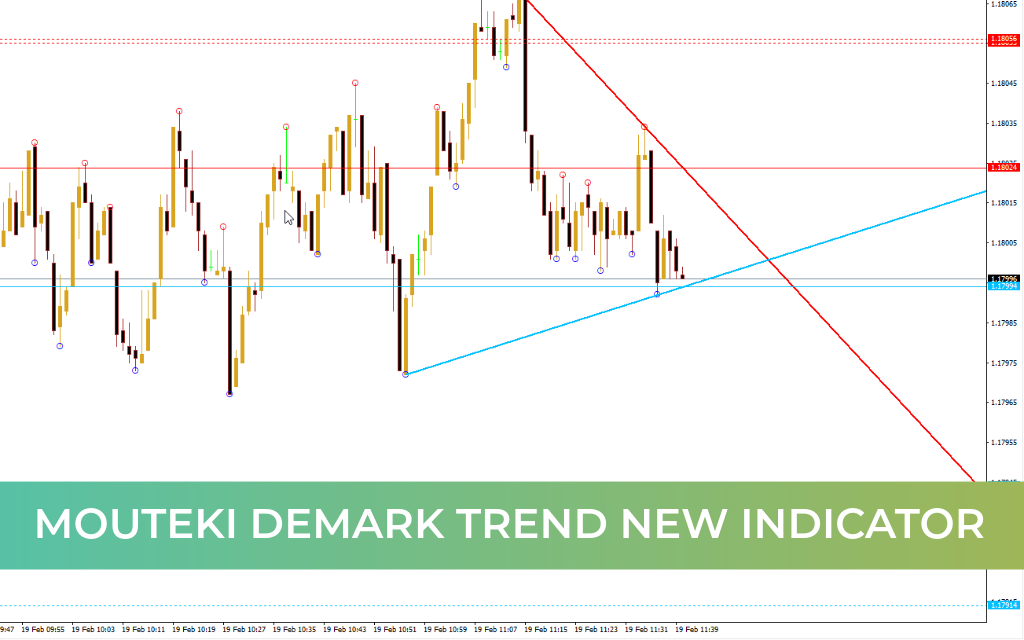
The Mouteki Demark Trend New Indicator combines principles from the Mouteki and Demark trendline methodologies to identify and analyze market trends with greater clarity.
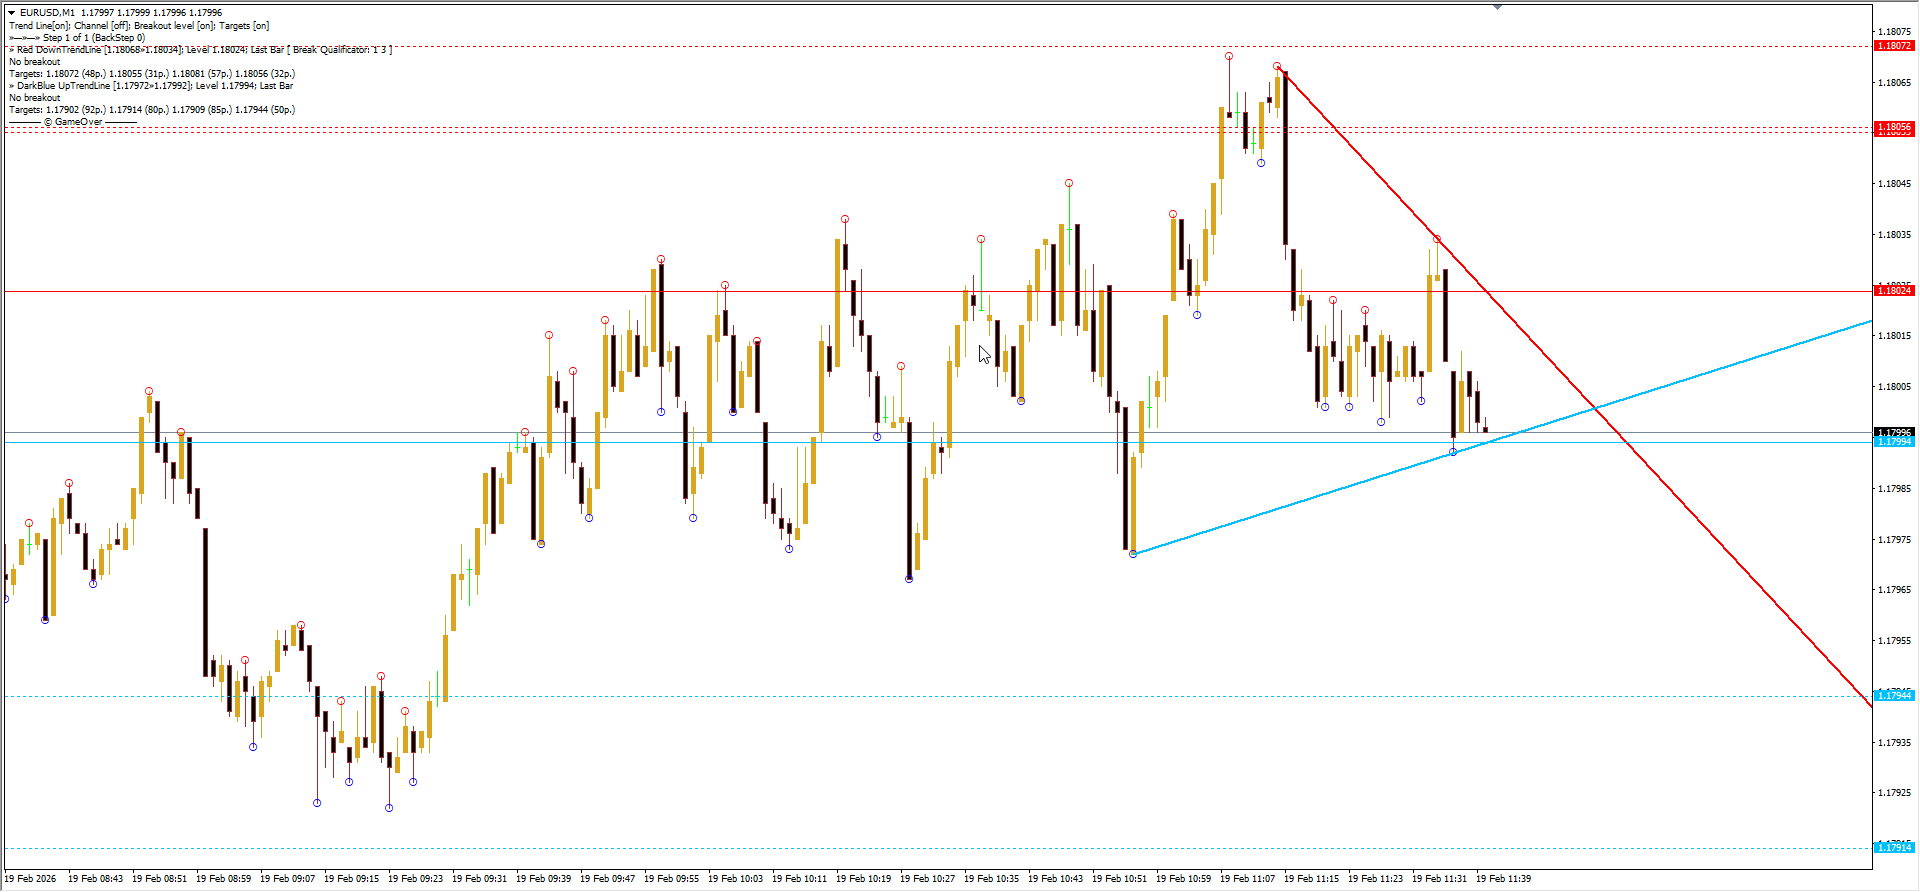
The indicator automatically plots trendlines to highlight the prevailing market direction and displays red and blue circles to signal potential trend reversals. In addition, it automatically draws Support And Resistance levels, providing traders with key price zones for decision-making.
When a red circle appears during an uptrend, it indicates a possible bearish reversal. Conversely, a blue circle appearing in a downtrend suggests a potential bullish reversal.
How to Use the Mouteki Demark Trend New Indicator in MT4
The indicator’s primary feature is the automatically generated trendline, which helps traders quickly determine market direction:
An upward-sloping trendline confirms a bullish market trend.
A downward-sloping trendline indicates a bearish market trend.
The indicator also plots colored circles that serve as early warning signals of potential reversals:
Red circle in an uptrend → possible bearish reversal
Blue circle in a downtrend → possible bullish reversal
Additionally, the indicator identifies and plots support and resistance levels, helping traders locate potential entry, exit, and breakout zones.
Conclusion
The Mouteki Demark Trend New Indicator for MT4 provides a comprehensive market analysis by combining adaptive trendlines, reversal signals, and support/resistance levels. This multi-functional approach helps traders better understand Market Structure, anticipate potential reversals, and make more informed trading decisions.
FAQ
3 Downloads
Published:
Feb 19, 2026 04:43 AM
Category: