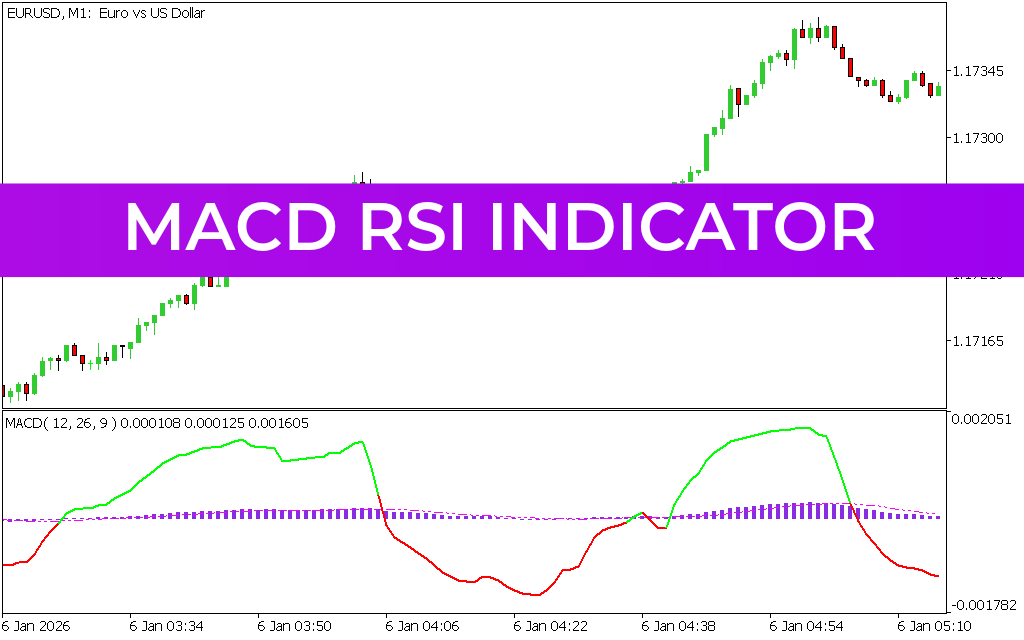
The MACD RSI Indicator for MT5 is a combined momentum trading tool that merges two of the most widely used indicators in technical analysis: MACD (Moving Average Convergence Divergence) and RSI (Relative Strength Index). This hybrid approach helps traders identify trend direction, momentum strength, and overbought/oversold conditions in a single indicator window.
By combining these two powerful oscillators, the indicator provides clearer BUY and SELL signals across different market conditions.
What Is the MACD RSI Indicator?
The MACD RSI Indicator integrates:
- Fast EMA (trend responsiveness)
- Slow EMA (trend direction filter)
- Signal SMA (confirmation line)
- RSI-based momentum zone levels (overbought/oversold)
It replaces the traditional MACD histogram with enhanced bar signals while using RSI logic to detect market extremes.
Key RSI levels:
- Above 70 → Overbought condition
- Below 30 → Oversold condition
Key Features of MACD RSI Indicator for MT5
- Combines MACD and RSI into one tool
- Displays momentum bars instead of standard histogram
- Identifies overbought and oversold conditions
- Uses EMA crossover logic for trend direction
- Works on all currency pairs and timeframes
- Suitable for Scalping, intraday, and swing trading
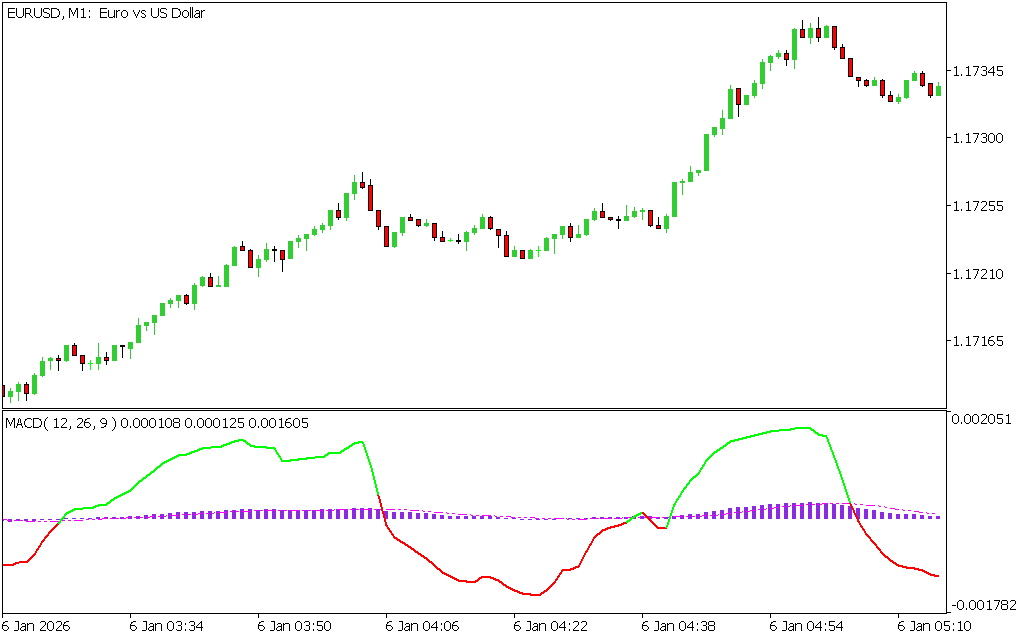
How the MACD RSI Indicator Works
The indicator evaluates both trend and momentum:
- MACD component: identifies trend direction using EMA crossovers
- RSI component: detects overbought/oversold market conditions
- Signal line (SMA): confirms trade entries
This combination helps traders filter weak signals and focus on stronger setups.
BUY and SELL Signals
Buy Signal
A BUY setup occurs when:
- Bars are in the oversold zone (below 30 RSI level)
- Fast EMA is positioned below slow EMA (Trend Reversal setup)
- Price begins showing upward momentum
Entry: Buy after bullish confirmation in oversold zone
Stop Loss: Below recent swing low
Exit: When momentum weakens or overbought zone appears
Sell Signal
A SELL setup occurs when:
- Bars are in the overbought zone (above 70 RSI level)
- Fast EMA is above slow EMA (bearish reversal setup)
- Price begins showing downward momentum
Entry: Sell after bearish confirmation in overbought zone
Stop Loss: Above recent swing high
Exit: When momentum weakens or oversold zone appears
How to Use MACD RSI Effectively
To improve accuracy:
- Wait for momentum confirmation before entering trades
- Avoid trading during strong consolidation phases
- Combine with Price Action signals (candlestick patterns)
- Use higher timeframe trend direction as a filter
- Focus on clean overbought/oversold reversals
Best Timeframes
The MACD RSI Indicator performs well on:
- M15 and M30 for scalping
- H1 and H4 for intraday trading
- Daily charts for swing trading
Higher timeframes help reduce false signals.
Recommended Indicator Combinations
For stronger trading performance, combine with:
- Support & Resistance zones
- Moving Averages (trend filtering)
- MACD or RSI standalone confirmation
- Price action patterns (engulfing, pin bars)
Advantages of MACD RSI Indicator
- Combines two powerful momentum indicators
- Filters weak and false signals
- Clear overbought and oversold identification
- Works in multiple trading styles
- Easy to understand for beginners
Limitations
- Can produce false signals in volatile markets
- Requires confirmation for best accuracy
- Works better in trending conditions than sideways markets
- Not ideal as a standalone system
Conclusion
The MACD RSI Indicator for MT5 is a powerful hybrid momentum tool that combines the strengths of MACD and RSI to deliver clearer trend direction and reversal signals. By analyzing both momentum and Trend Strength, it helps traders identify high-probability BUY and SELL opportunities.
When used with proper confirmation techniques and risk management, it becomes a valuable addition to any Forex trading strategy.
4 Downloads
Published:
Apr 13, 2026 09:21 AM
Category: