Free
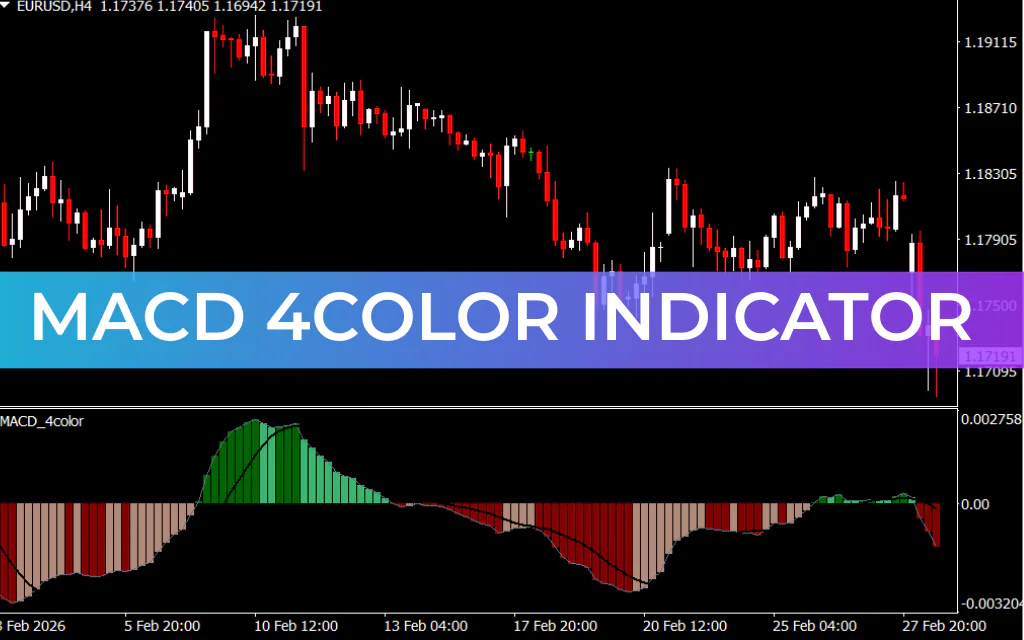
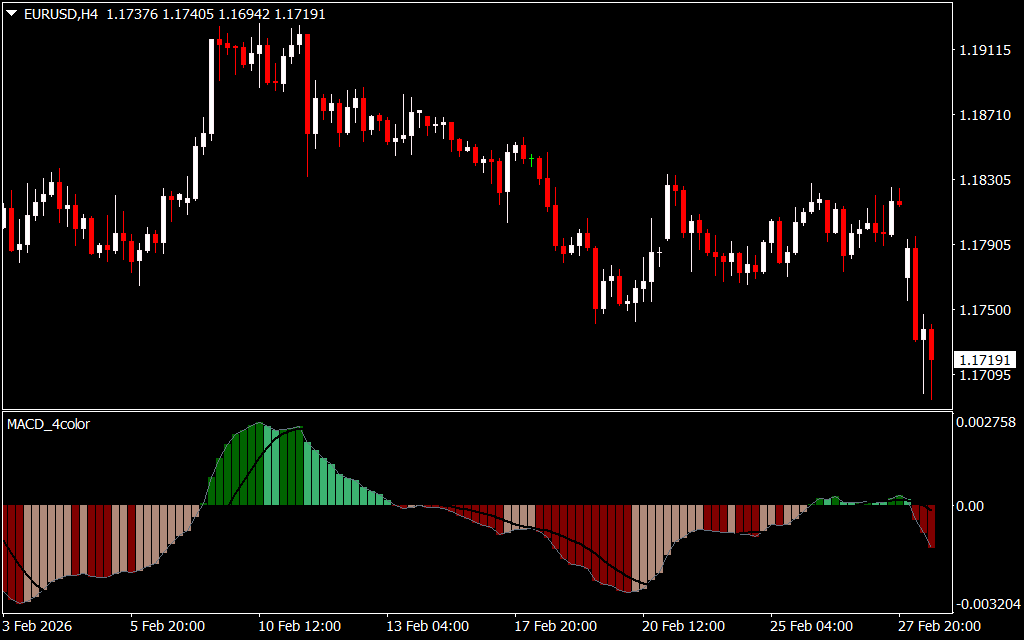
The MACD 4Color Indicator is a modified version of the traditional Moving Average Convergence Divergence (MACD) indicator designed for MT4. It keeps the core MACD functionality while adding enhanced visual cues using four-color histogram bars to indicate Trend Strength and potential reversals.
Key Features
- Two Main Lines:
- MACD line: Difference between the short-term EMA and long-term EMA.
- Signal line: Smoothed average of the MACD line.
- Four-Color Histogram:
- Dark Green: Strong bullish momentum.
- Light Green: Weakening bullish trend.
- Red: Bearish trend.
- Light Red / Fading Red: Possible trend weakening or reversal.
- Trend Strength & Direction:
- Colors and bar lengths help visualize trend momentum and Trend Reversal potential.
How to Use the MACD 4Color Indicator for MT4
- Bullish Trend (Buy Signal):
- MACD line is above the signal line.
- Histogram bars are dark green → strong uptrend.
- Light green bars may indicate a weakening bullish momentum → monitor closely.
- Bearish Trend (Sell Signal):
- MACD line is below the signal line.
- Histogram bars are red → strong downtrend.
- Light red or fading bars indicate possible trend weakening or upcoming reversal.
- Trend Reversal Insight:
- Switching from dark green to light green or from red to light red suggests a potential trend reversal.
- Combine with Price Action, support/resistance, or other indicators for higher accuracy.
Benefits of the MACD 4Color Indicator
- Provides clear visual signals of trend direction and momentum.
- Highlights strength of trend using dark and light-colored histogram bars.
- Helps identify trend reversals early with fading color cues.
- Suitable for Scalping, intraday, swing trading, and all MT4 timeframes.
Conclusion
The MACD 4Color Indicator for MT4 enhances the classic MACD by using a four-color histogram to visually communicate trend strength and weakening. Traders can use it to spot bullish and bearish trends, anticipate reversals, and make more informed entry and exit decisions.
FAQ
It keeps core MACD functionality while adding enhanced visual cues. Two main lines: MACD line (difference between short-term and long-term EMA), Signal line (smoothed average of MACD). Four-color histogram: Dark green = strong bullish. Light green = weakening bullish. Red = bearish. Light/fading red = possible weakening or reversal.
Bullish: MACD above signal line. Dark green bars = strong uptrend. Light green = weakening, monitor closely. Bearish: MACD below signal line. Red bars = bearish trend. Light red = possible reversal.
Visualize trend momentum. Indicate trend reversal potential. Colors and lengths provide quick interpretation.
Traders wanting enhanced MACD visualization. Those identifying trend strength and reversals. MT4 users.
Four-color histogram. Clearer trend strength. Reversal potential. Visual enhancement.
1 Download
Published:
Mar 02, 2026 09:56 AM
Category:
Share: