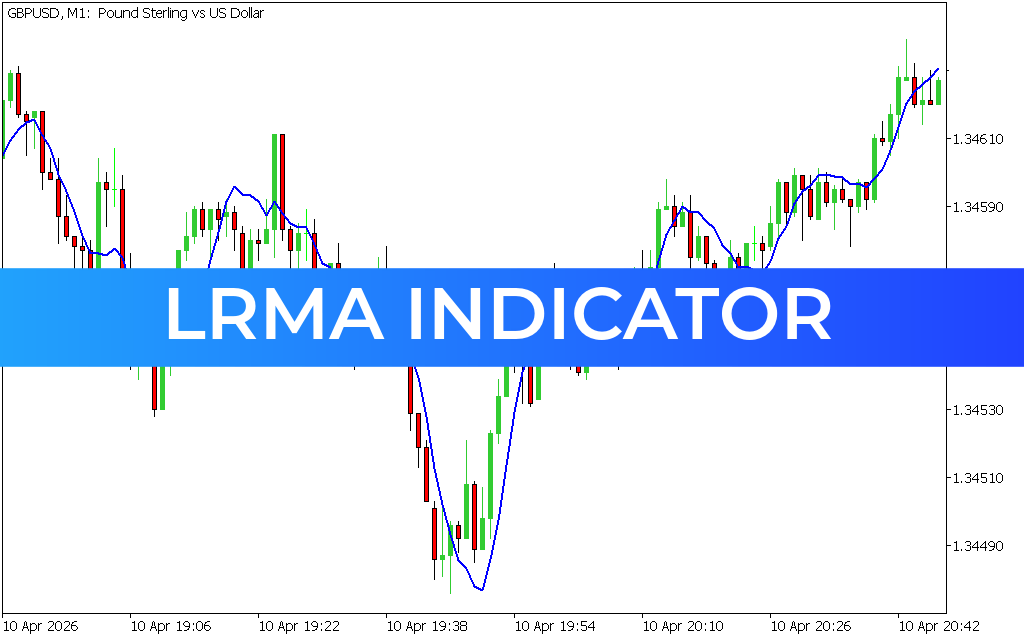
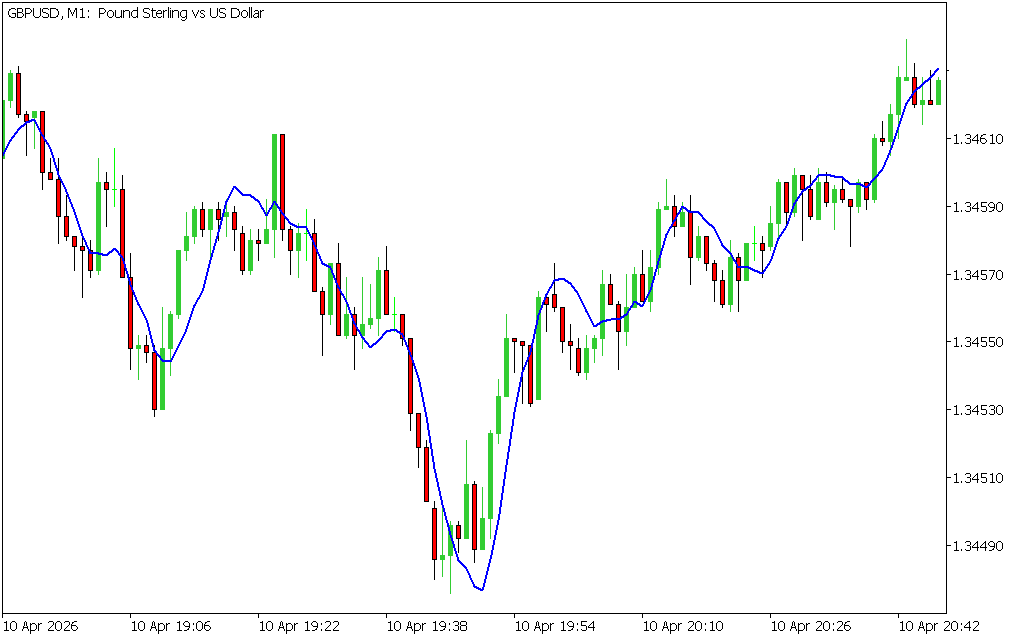
The LRMA Indicator (Linear Regression Moving Average) for MetaTrader is a powerful trend-following tool designed to help traders identify market direction and Trend Strength with precision. It is especially useful for analyzing trend slope and momentum, making it a valuable addition to any trading strategy.
Whether you're a beginner or an experienced trader, the LRMA Indicator can significantly improve your ability to spot high-probability trade setups.
What is Linear Regression?
Linear regression is a statistical method used to forecast future price movements based on historical data. It applies the least squares method to plot a best-fit line through a series of price points.
In trading, this concept is used to create a dynamic indicator that tracks the overall direction of the market more smoothly than traditional moving averages.
What is the LRMA Indicator?
The Linear Regression Indicator is a moving average-style tool built using advanced algorithms that automatically calculate the regression line of price data.
Unlike standard moving averages, the LRMA reacts more accurately to price changes, helping traders:
- Identify trend direction
- Measure trend strength
- Detect potential reversals
Is the Linear Regression Line a Good Indicator?
Yes, the LRMA Indicator is widely regarded as an effective trading tool because it provides clear insights into:
- Market trends
- Price momentum
- Volatility conditions
Key Benefits:
- Suitable for beginners, intermediate, and advanced traders
- Works across multiple strategies: Scalping, intraday, and swing trading
- Easy to read and apply on charts
- Helps filter market noise
How to Read It:
- Price above the LRMA line → Bullish trend
- Price below the LRMA line → Bearish trend
How to Trade with the LRMA Indicator
The LRMA Indicator works best when combined with Price Action or other technical indicators for confirmation.
Buy Signal (Long Entry)
A potential BUY setup occurs when:
- Price crosses above the LRMA line
- A bullish candlestick pattern appears (e.g., bullish engulfing, pin bar)
Sell Signal (Short Entry)
A potential SELL setup occurs when:
- Price crosses below the LRMA line
- A bearish candlestick pattern forms
Using confirmation signals helps improve accuracy and reduces false entries.
Why Use the LRMA Indicator?
The LRMA Indicator stands out because it:
- Provides a more precise trend slope
- Adapts quickly to price changes
- Enhances decision-making with clearer signals
It is highly recommended for traders who want a reliable and simple trend-following indicator.
Conclusion
The LRMA Indicator for MetaTrader (MT4/MT5) is a powerful and user-friendly technical analysis tool that helps traders identify trends with greater accuracy. Its ability to combine trend detection and momentum analysis makes it an essential tool for improving trading performance.
Best of all, it is completely free to download, making it accessible for traders at all levels.
Published:
Apr 11, 2026 03:54 AM
Category: