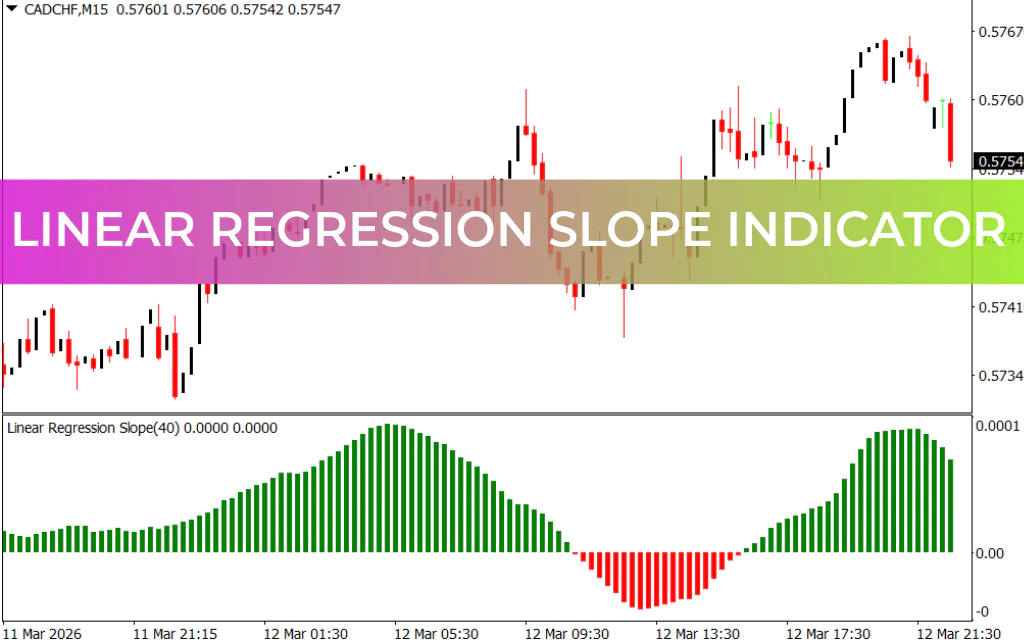
The Linear Regression Slope Indicator for MT4 is a technical analysis tool that calculates the slope of a linear regression line to determine market direction and momentum. Instead of drawing the regression line directly, the indicator plots histogram bars that show the strength and direction of the trend.
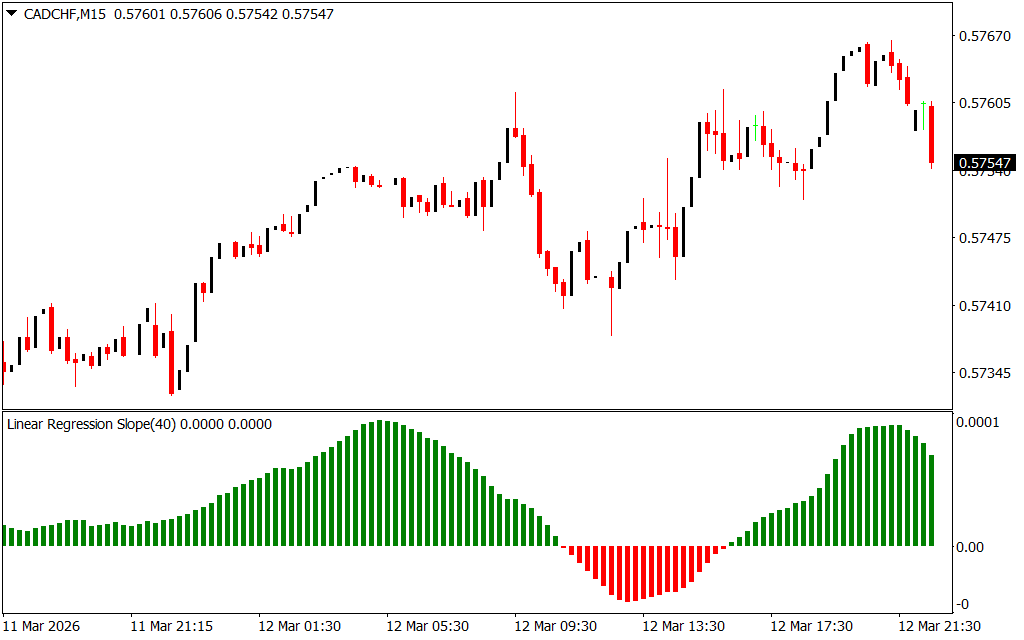
- Green bars: Indicate bullish momentum
- Red bars: Indicate bearish momentum
- Bar length: Shows the strength of the momentum
When the histogram bars become longer, momentum is increasing. When they shorten, it signals weakening momentum and possible trend exhaustion.
How the Linear Regression Slope Indicator Works
The indicator uses the zero line as a key reference point to determine trade signals and market conditions.
Buy Signal
- The histogram crosses above the zero line
- Bars change to green, indicating bullish momentum
- Traders may open a buy position
Exit:
- When the histogram changes from green to red, signaling bearish momentum.
Sell Signal
- The histogram changes from green to red
- Indicates a shift toward bearish momentum
- Traders may open a sell position
Exit:
- When the histogram changes back to green.
Identifying Market Momentum
The length of the histogram bars gives important insight into momentum:
- Long bars: Strong trend momentum
- Short bars: Weak or fading momentum
- Bars near zero line: Market may be ranging or consolidating
When bars stay close to the zero line, it’s usually better to avoid trading until momentum increases.
Example Trading Scenario
On an AUD/USD chart, the indicator shows short histogram bars when the market is ranging. As the uptrend begins, green bars start to appear and lengthen, indicating strengthening bullish momentum.
When the bars change from green to red, the trend reverses and the indicator signals bearish momentum, which may present a short trading opportunity.
Advantages of the Linear Regression Slope Indicator
- Measures trend direction and momentum simultaneously
- Simple histogram visualization for easy analysis
- Helps identify strong trends vs ranging markets
- Suitable for all timeframes
- Useful for Scalping, intraday, and swing trading
- Free to download and install on MT4
Conclusion
The Linear Regression Slope Indicator for MT4 is a powerful tool for traders who want to analyze Trend Strength and momentum. By plotting histogram bars based on the regression slope, it provides clear signals for bullish and bearish market conditions. For better trading results, it’s recommended to combine the indicator with Price Action or other technical indicators for confirmation.
FAQ
Published:
Mar 12, 2026 17:59 PM
Category: