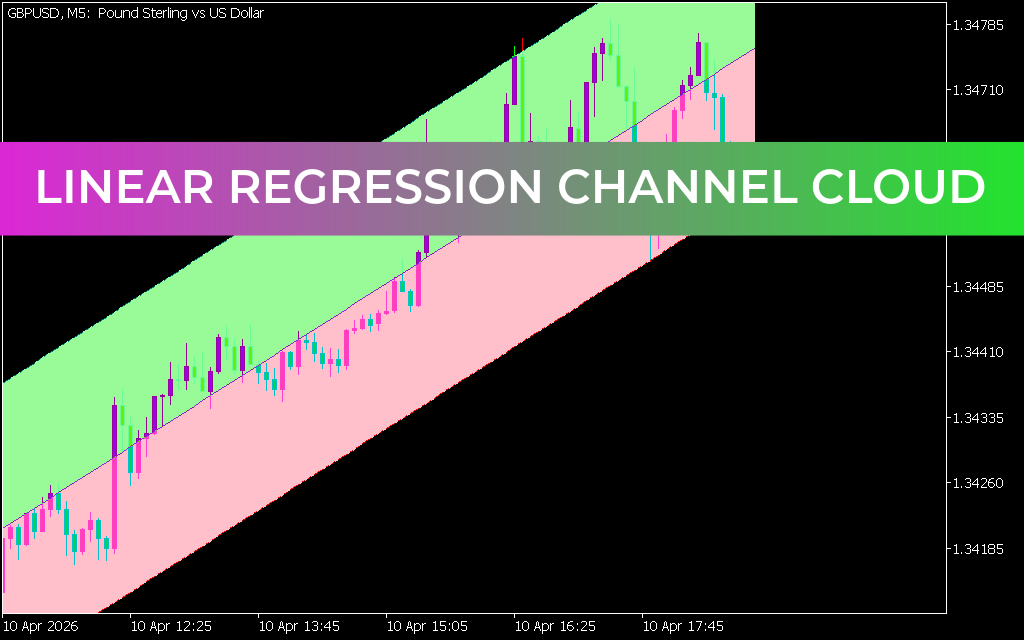
The Linear Regression Channel Cloud Indicator for MetaTrader 5 is a highly adaptive technical analysis tool that automatically draws multiple regression channels on the chart. It continuously updates in real time, identifying new trend structures as market conditions evolve.
Designed for the MetaTrader 5 trading platform, this indicator is widely used by scalpers, intraday traders, and swing traders to analyze trend direction, support/resistance zones, and breakout opportunities.
What Is a Linear Regression Channel?
A linear regression channel is a statistical trend tool used to analyze price direction and volatility. It consists of three key components:
- Upper channel line: Resistance zone
- Lower channel line: Support zone
- Central regression line: Trend direction
The channel adjusts dynamically as price evolves, helping traders identify whether the market is trending upward, downward, or moving sideways.
Key Features
- Automatically plots dynamic regression channels
- Continuously adapts to trend changes
- Works across multiple timeframes (MTF capable)
- Identifies support and resistance zones
- Suitable for both trend and breakout strategies
How the Indicator Works
The indicator tracks price behavior within a moving statistical channel:
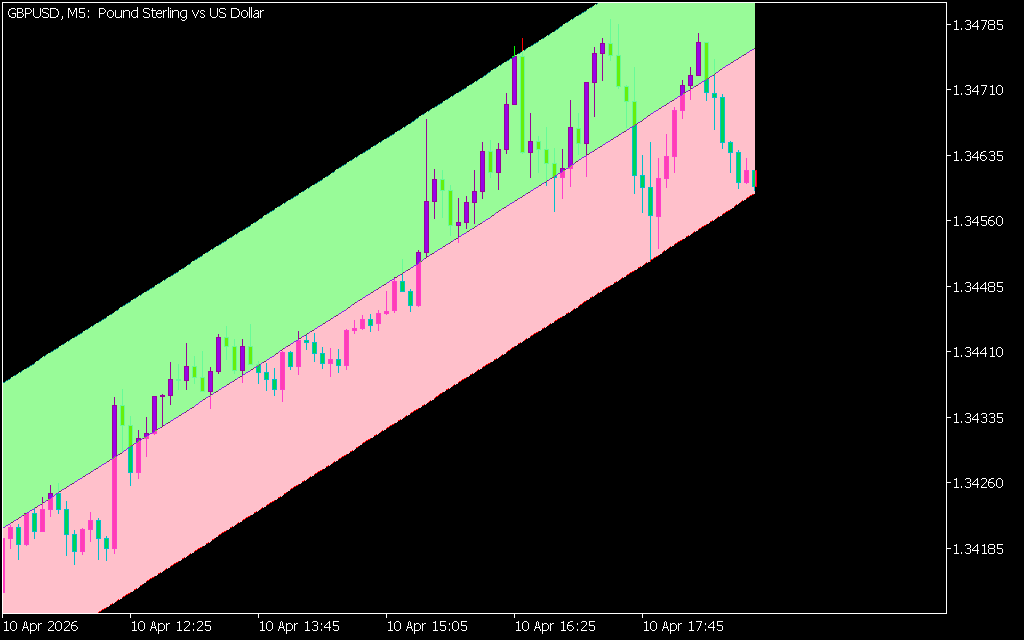
- 📈 Uptrend: Channel slopes upward
- 📉 Downtrend: Channel slopes downward
- ⚪ Sideways: Channel flattens or compresses
Price interaction with channel boundaries provides potential trading opportunities.
How to Trade Using the Linear Regression Channel
📈 Buy Setup (Trend Continuation)
- Price is in an upward-sloping channel
- Price pulls back to the lower channel line
- Bullish rejection appears (candlestick confirmation)
- Enter buy trade in direction of trend
📉 Sell Setup (Breakout or Reversal)
- Price breaks below the lower channel boundary
- Retests the broken level as resistance
- Shows bearish rejection
- Enter sell trade after confirmation
Breakout Trading Strategy
The indicator is especially effective for breakout trading:
- Price breaks above or below the channel
- Wait for a retest of the broken level
- Enter in direction of breakout
- Use opposite channel boundary for stop-loss reference
This follows the principle that broken support often becomes resistance and vice versa.
Example Trading Logic (GBP/USD M15)
On an GBP/USD M15 chart:
- Price repeatedly respects the lower channel in an uptrend
- Bullish wicks indicate strong support and continuation setups
- Later, a channel breakdown followed by retest signals bearish reversal
Why Traders Use This Indicator
- Provides clear visual trend structure
- Defines dynamic support and resistance zones
- Works for both trend-following and breakout strategies
- Reduces subjectivity in channel drawing
Best Practices
To improve trading accuracy:
- Combine with Price Action confirmation (candlesticks, patterns)
- Use higher timeframe trend alignment (MTF analysis)
- Avoid trading during weak or flat channels
- Always wait for retest confirmation after breakout
Conclusion
The Linear Regression Channel Cloud Indicator for MT5 is a dynamic trend analysis tool that automatically maps Market Structure using statistical regression channels. It helps traders identify trend direction, reversal zones, and breakout opportunities with greater clarity. When combined with price action and confirmation tools, it becomes a powerful addition to any trading strategy.
3 Downloads
Published:
Apr 10, 2026 11:59 AM
Category: