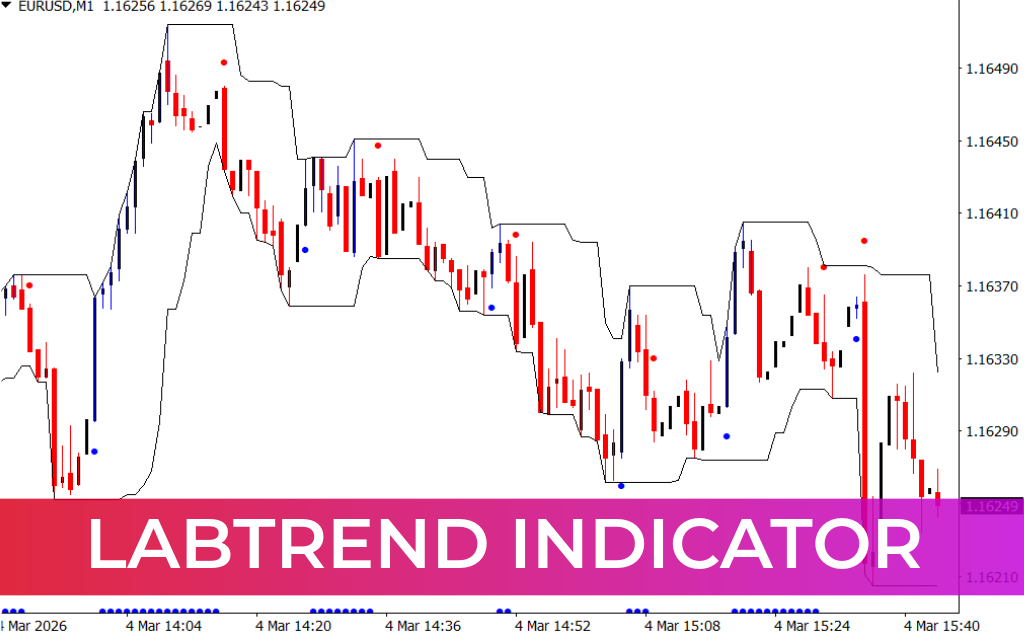
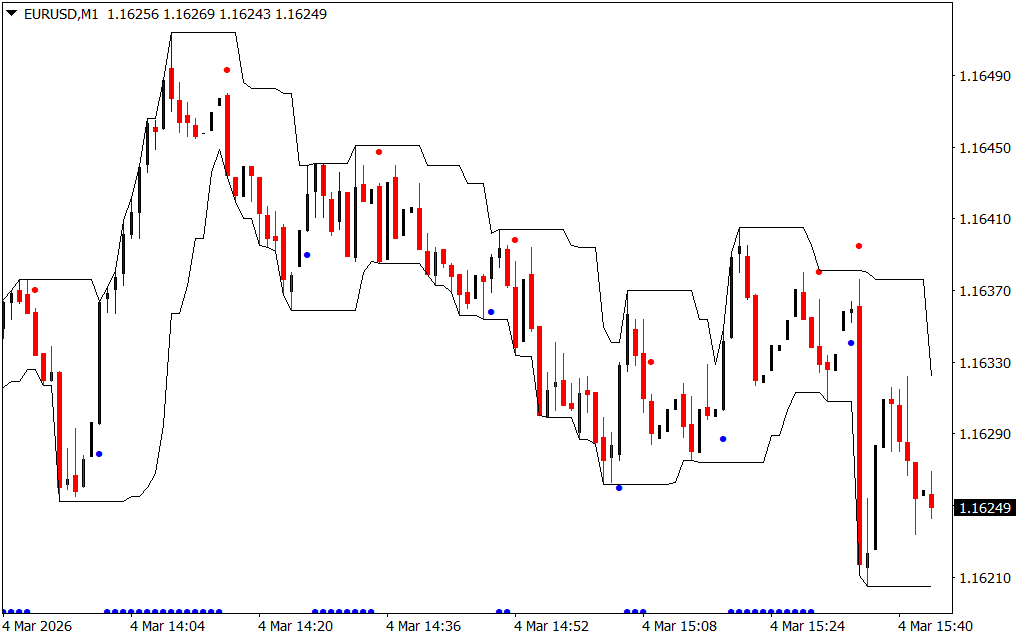
The LabTrend Indicator for MetaTrader 4 is a powerful trading tool designed to provide clear trend-following signals and identify potential trend exhaustion zones. Unlike simpler trend indicators like the ASC Trend, LabTrend combines trend analysis with reversal detection to help traders optimize entry and exit points.
How the LabTrend Indicator Works
The indicator uses advanced algorithms to generate visual signals for trend direction and potential reversals:
- Blue Dot: Signals the beginning of a bullish trend, suggesting a buy opportunity.
- Red Dot: Signals the beginning of a bearish trend, suggesting a sell opportunity.
- Black Lines: Enclose candlesticks to mark potential trend exhaustion zones, indicating when to exit trades.
When multiple wick rejections occur near the black lines followed by a flat line, it signals a likely Trend Reversal, helping traders anticipate exit points.
How to Trade with the LabTrend Indicator
- Entry Signals:
- Enter a buy trade when a blue dot appears in line with bullish Price Action.
- Enter a sell trade when a red dot appears with bearish price action.
- Trend Reversal & Exit:
- Monitor wick rejections near the black lines. A flat line signals an optimal exit zone.
- Trade Confirmation:
- Combine LabTrend signals with price action patterns or other technical indicators to improve accuracy.
- Timeframe Flexibility:
- Suitable for Scalping, intraday, and day trading depending on the signal timeframe.
Conclusion
The LabTrend Indicator for MT4 is a versatile trend-following tool that delivers accurate buy/sell signals and helps identify potential trend reversals. It is ideal for novice, intermediate, and advanced traders seeking clear trade entries and exits. You can download the LabTrend Indicator for free and enhance your trading strategy today.
FAQ
3 Downloads
Published:
Mar 04, 2026 09:46 AM
Category: