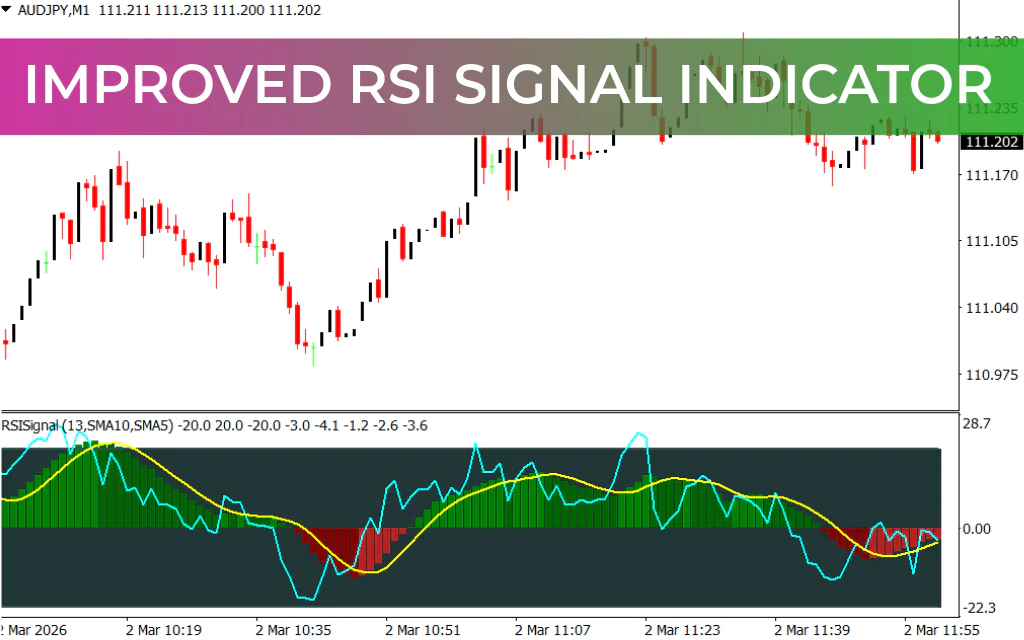
The Improved RSI Signal Indicator for MetaTrader 4 is a sophisticated trend and reversal detection tool designed to identify high-probability trading opportunities in forex and other financial markets. By combining the Relative Strength Index (RSI) with Moving Averages (MA), this indicator highlights overbought and oversold zones while also measuring market momentum.
With a clear histogram and multiple RSI lines, the Improved RSI Signal Indicator provides a visual and systematic approach to spotting bullish and bearish market conditions.
Key Features
- Multiple RSI Lines – Uses three RSI lines to detect Trend Strength and reversal zones
- Moving Averages Integration – Enhances accuracy and reduces false signals
- Histogram Display – Green bars indicate bullish trends, red bars indicate bearish trends
- Optimized for Scalping and Day Trading – Works across intraday, daily, and short-term charts
- Trade Confirmation – Combines Price Action with RSI crossovers for precise entries
How the Improved RSI Signal Indicator Works
The indicator generates signals when the yellow RSI line crosses above or below the aqua RSI line relative to the zero line:
- Buy Signal: Yellow RSI crosses above aqua RSI and histogram bars turn green.
- Sell Signal: Yellow RSI crosses below aqua RSI and histogram bars turn red.
This multi-layered approach helps traders identify trend reversals with higher confidence while filtering out false signals.
Trading Strategy with the Indicator
Buy Setup
- Wait for the yellow RSI to cross above the aqua RSI.
- Confirm that the histogram bars are green, signaling bullish momentum.
- Ensure candlestick closes in alignment with the bullish trend.
- Enter a buy trade at the open of the next candle.
- Place stop loss below the recent swing low.
Sell Setup
- Wait for the yellow RSI to cross below the aqua RSI.
- Confirm that the histogram bars are red, signaling bearish momentum.
- Ensure candlestick closes in alignment with the bearish trend.
- Enter a sell trade at the open of the next candle.
- Place stop loss above the recent swing high.
This alignment of RSI crossover, histogram, and candlestick confirmation improves trade accuracy and reduces unnecessary exposure.
Why Traders Use the Improved RSI Signal Indicator
- Quickly identifies overbought and oversold conditions
- Confirms trend direction with histogram and MA filters
- Visualizes high-probability buy and sell zones
- Suitable for scalping, intraday, and day trading
- Reduces noise compared to traditional RSI indicators
The combination of multiple RSI lines, histogram, and moving averages makes it easier to track both trend strength and potential reversals in real time.
Conclusion
The Improved RSI Signal Indicator for MetaTrader 4 is a comprehensive forex trading system that combines RSI and Moving Averages with histogram visualization to identify optimal trade setups. Perfect for scalping and intraday trading, it helps traders enter trades with higher precision and confidence.
FAQ
1 Download
Published:
Mar 02, 2026 06:00 AM
Category: