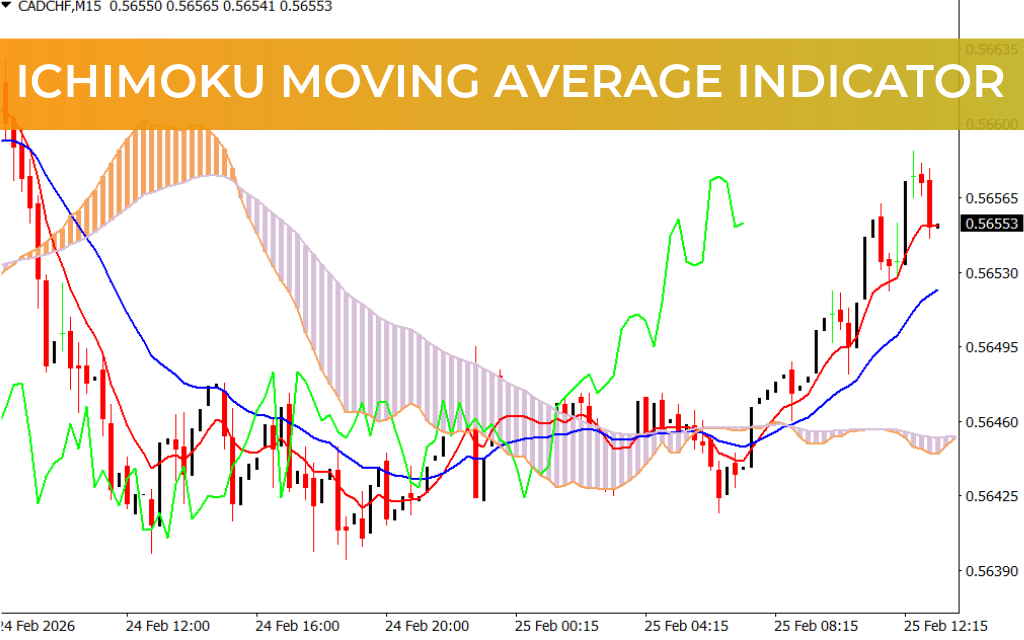
The Ichimoku Moving Average Indicator blends the proven principles of Ichimoku Kinko Hyo with the adaptability of moving averages, creating a powerful and simplified trend-following system. Designed for clarity and precision, this indicator helps traders identify strong buy and sell signals while maintaining a clean and easy-to-read chart structure.
Whether you are a beginner seeking structured guidance or an experienced trader aiming to refine entry timing, the Ichimoku Moving Average Indicator adapts to various market conditions and trading styles.
Key Features of the Ichimoku Moving Average Indicator
Tenkan Line – Short-Term Momentum
The Tenkan line reflects short-term price momentum and helps traders detect early entry opportunities. Quick shifts in this line often signal potential changes in market direction.
Kijun Line – Trend Confirmation
The Kijun line acts as a medium-term trend benchmark.
- When price crosses above the Kijun line, it suggests a potential bullish trend.
- When price crosses below it, it may indicate a developing bearish trend.
This crossover system offers clear and actionable trading signals.
Senkou Span – Dynamic Support & Resistance
The Senkou span forms a shaded cloud that highlights dynamic Support And Resistance levels. This visual zone helps traders:
- Identify key price reaction areas
- Confirm Trend Strength
- Avoid low-probability trades
The cloud structure also provides insight into overall market sentiment and future price bias.
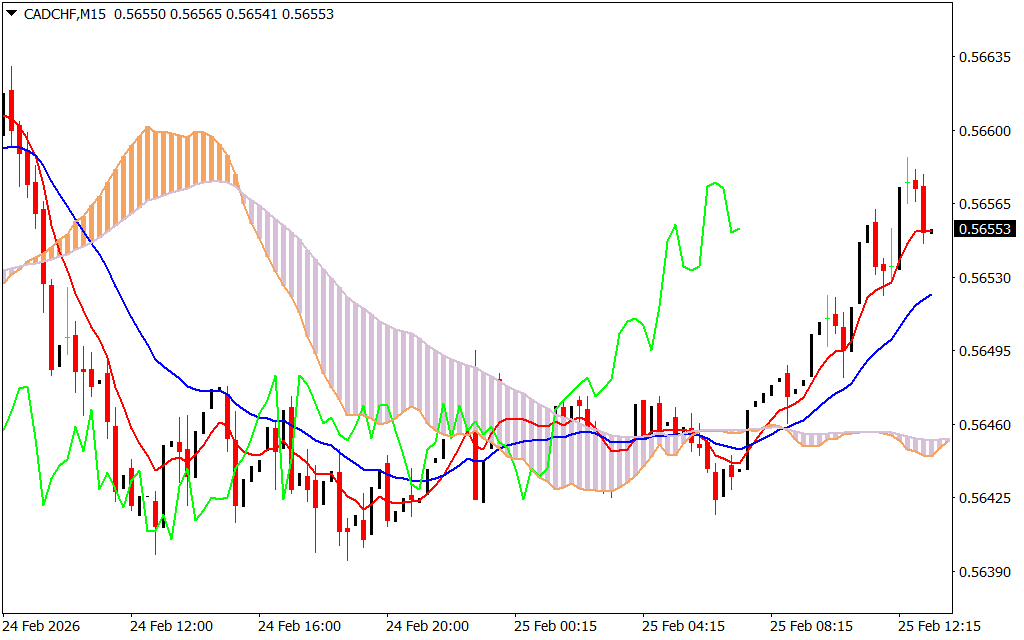
How the Ichimoku Moving Average Indicator Works
The indicator analyzes the relationship between:
- Price and the Kijun line
- Tenkan and Kijun crossovers
- Price position relative to the cloud (Senkou span)
When these elements align, traders can identify high-probability setups with improved confidence. The combination of moving average flexibility and Ichimoku structure allows for smoother trend detection while reducing market noise.
This makes it effective across multiple timeframes and suitable for Forex, indices, commodities, and crypto markets.
Why Traders Choose the Ichimoku Moving Average Indicator
- Combines moving averages with Ichimoku logic
- Clear buy and sell signals
- Dynamic support and resistance zones
- Works in trending and volatile markets
- Improves timing and trade precision
- Beginner-friendly visual structure
By simplifying complex market data into structured visual components, this indicator enhances decision-making and supports consistent trading performance.
Final Thoughts
The Ichimoku Moving Average Indicator is a versatile and reliable technical analysis tool that strengthens trend identification and market timing. By integrating the Tenkan, Kijun, and Senkou lines with moving average adaptability, it delivers accurate signals and improved clarity.
If you want to refine your trading strategy, identify key levels faster, and improve your overall market analysis, this indicator is an essential addition to your trading setup.
FAQ
1 Download
Published:
Feb 25, 2026 07:29 AM
Category: