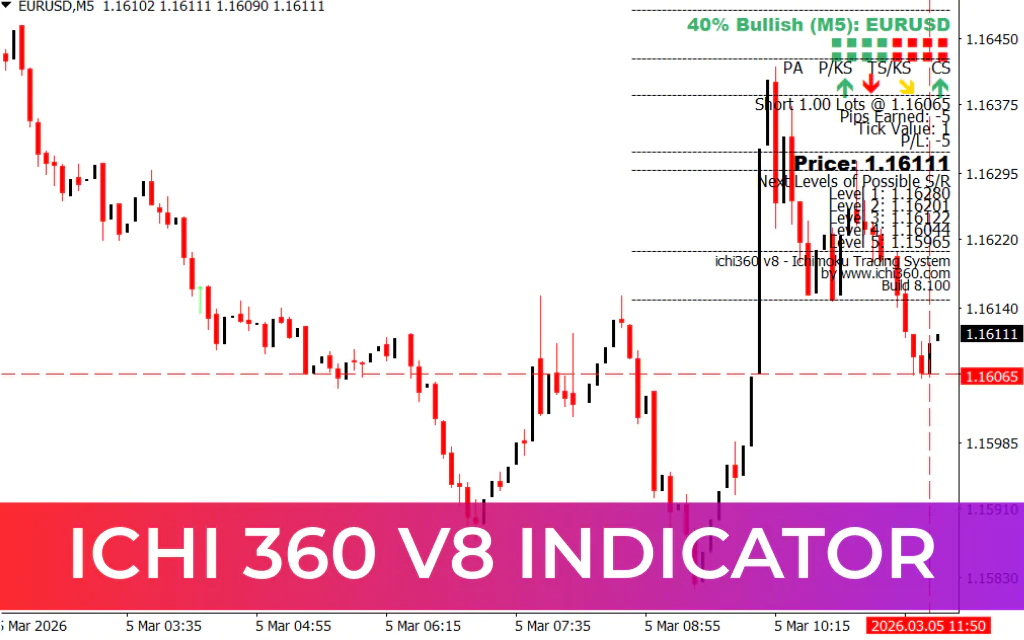
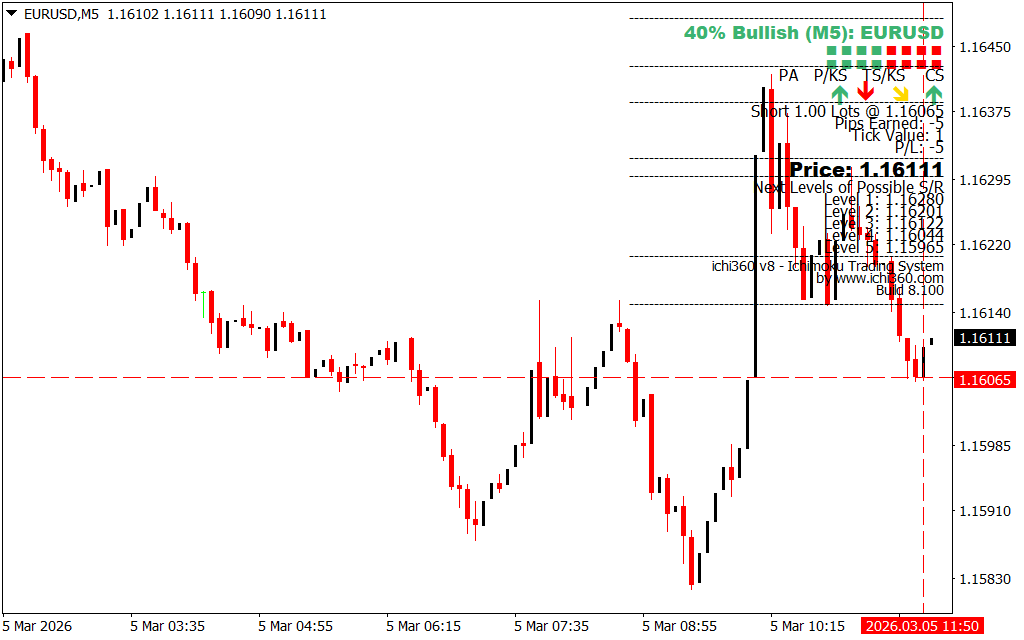
The Ichi 360 v8 Indicator for MT4 is an advanced technical analysis tool built around the Ichimoku Cloud trading system. It helps traders identify market trends, potential Support And Resistance levels, and profit/loss estimates directly on the chart.
Unlike the traditional Ichimoku setup, the Ichi 360 v8 Indicator simplifies analysis by focusing on the most important components of the system. In addition to trend analysis, it also includes a built-in profit and loss calculator, allowing traders to quickly estimate potential trade outcomes based on lot size and market direction.
Another advantage of this indicator is its compatibility with all MT4 timeframes, making it suitable for both short-term and long-term trading strategies.
Key Components of the Ichi 360 v8 Indicator
The indicator combines several elements of the Ichimoku system along with additional trading tools.
Ichimoku Cloud Lines
The indicator uses several important Ichimoku lines:
- PA (Leading Span A) – Helps define the cloud structure and trend direction.
- P/KS (Kijun-sen) – Acts as a key trend and Momentum Indicator.
- TS/KS (Tenkan-sen) – A faster line used to detect short-term momentum.
- CS (Chikou Span) – Confirms Trend Strength by comparing current price with past price levels.
Unlike the standard Ichimoku system, this indicator does not include Leading Span B, simplifying the visual analysis.
Profit/Loss Calculator
A unique feature of the Ichi 360 v8 Indicator is its built-in P/L calculator. It automatically estimates potential profit or loss based on:
- Current market trend
- Trade direction
- Selected lot size
This feature helps traders better manage risk and reward before entering a trade.
Support and Resistance Levels
The indicator also highlights key support and resistance zones. These levels can be used to:
- Set take-profit targets
- Place stop-loss levels
- Identify potential market reversals
How to Trade With the Ichi 360 v8 Indicator
Buy Setup
- Check if the Ichimoku lines indicate bullish momentum.
- Confirm that price is trading above key support levels.
- Use the P/L calculator to evaluate potential trade results.
- Enter a buy position and set profit targets near resistance levels.
Sell Setup
- Look for bearish signals from the Ichimoku lines.
- Confirm that price is trading below resistance levels.
- Review the profit/loss estimate for risk management.
- Enter a sell trade with targets near support zones.
Trading Tips for Better Accuracy
- Combine the indicator with tools like RSI or Moving Averages for stronger confirmation.
- Focus on clear trend conditions rather than sideways markets.
- Use support and resistance levels for exit planning.
- Apply the indicator across multiple timeframes for better Trend Confirmation.
Key Benefits
- Based on the powerful Ichimoku Cloud trading system
- Includes a built-in profit and loss calculator
- Displays support and resistance levels
- Works on all MT4 timeframes
- Helps traders analyze trend strength and potential trade outcomes
Conclusion
The Ichi 360 v8 Indicator for MT4 is a comprehensive trading tool that combines Ichimoku trend analysis, support and resistance levels, and a profit/loss calculator. By providing multiple layers of information on a single chart, it helps traders better understand market momentum and plan trades more effectively.
For optimal results, combine the indicator with additional technical analysis tools and proper risk management strategies.
FAQ
Published:
Mar 05, 2026 05:57 AM
Category: