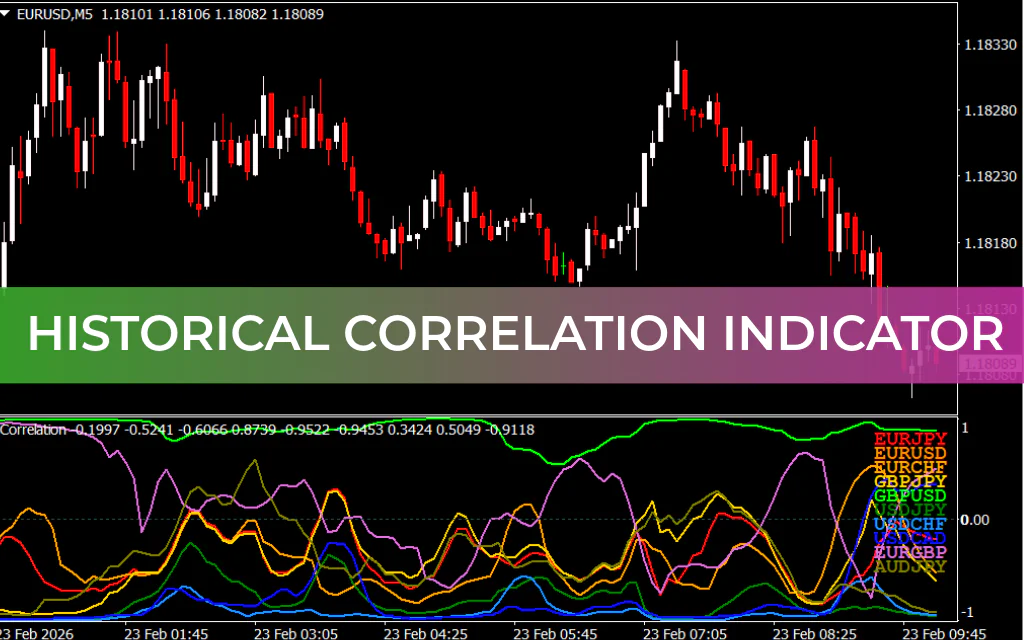
The Historical Correlation Indicator for MetaTrader 4 is an advanced analytical tool that helps traders monitor and visualize the statistical relationships between multiple currency pairs. By displaying the Pearson correlation coefficient in a clear multi-line format, the indicator allows traders to quickly identify positively and negatively correlated
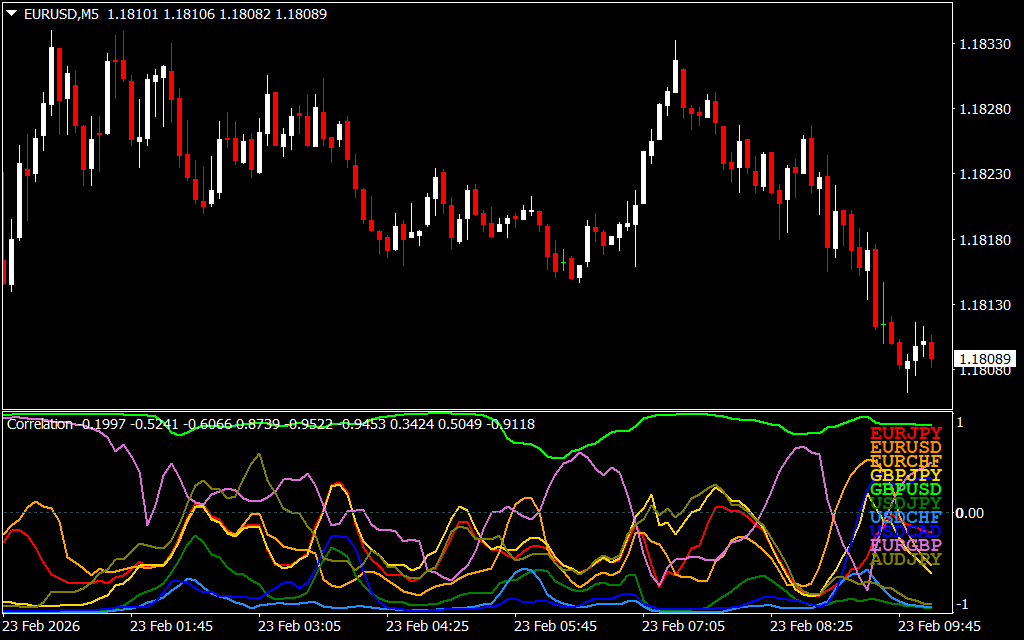
instruments.
For traders managing diversified portfolios or executing multi-pair strategies, understanding correlation is critical. This tool provides deeper insight into intermarket dynamics, helping reduce risk exposure and improve trade confirmation.
How the Historical Correlation Indicator Works
The indicator calculates and plots the correlation coefficient between selected instruments over a defined lookback period.
Correlation Interpretation
- +1 (Strong Positive Correlation) – Assets move in the same direction.
- 0 (No Correlation) – No meaningful relationship between instruments.
- -1 (Strong Negative Correlation) – Assets move in opposite directions.
Displayed as dynamic multi-line plots, the correlation values update in real time, giving traders a clear visual understanding of how relationships evolve under changing market conditions.
Trading Applications
While the indicator does not generate direct buy or sell signals, it provides valuable decision-making support:
- Trade Confirmation – Confirm setups when correlated pairs align.
- Hedging Strategies – Identify negatively correlated pairs for balanced exposure.
- Risk Management – Avoid stacking positions on highly correlated instruments.
- Diversification Planning – Select assets with lower correlation to reduce portfolio risk.
- Momentum Shifts – Spot sudden divergence in correlation lines that may signal emerging structural changes.
For example, if two pairs historically move together but begin to diverge, this may indicate a developing shift in macro sentiment or liquidity flow.
Key Benefits
1. Real-Time Correlation Tracking
Monitor evolving relationships between currency pairs instantly.
2. Portfolio Risk Control
Avoid overexposure by identifying highly correlated instruments.
3. Visual Multi-Line Display
Clear chart representation simplifies complex statistical data.
4. Strategy Optimization
Enhance intermarket and hedging strategies with data-backed insights.
5. Customizable Lookback Period
Adjust correlation calculations to match short-term or long-term strategies.
Conclusion
The Historical Correlation Indicator for MT4 is an essential tool for traders who operate across multiple currency pairs. By providing a dynamic visual representation of correlation strength and direction, it supports smarter portfolio construction, stronger trade confirmation, and more refined risk management.
Whether you are hedging positions, confirming setups, or analyzing cross-pair dynamics, this indicator adds a powerful statistical layer to your trading strategy.
FAQ
1 Download
Published:
Feb 23, 2026 04:10 AM
Category: