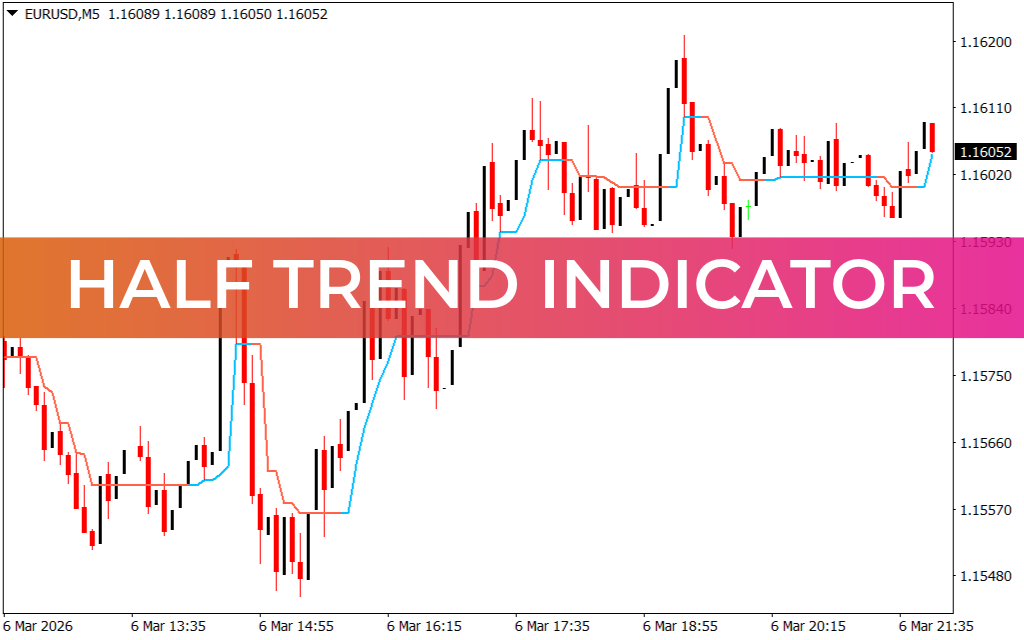
The Half Trend Indicator for MT4 is a popular trend-following trading tool that helps traders identify market direction and potential entry points. It works by plotting a signal line directly on the price chart that changes color depending on the current trend.
The indicator closely follows price movements and adjusts when market conditions shift. This makes it useful for identifying trend continuation and possible reversals on the MetaTrader 4 platform.
The signal line changes color to reflect the market direction:
- Blue Line → Indicates a bullish trend
- Red Line → Indicates a bearish trend
Because of its clear visual signals, the Half Trend Indicator is widely used by scalpers, day traders, and swing traders.
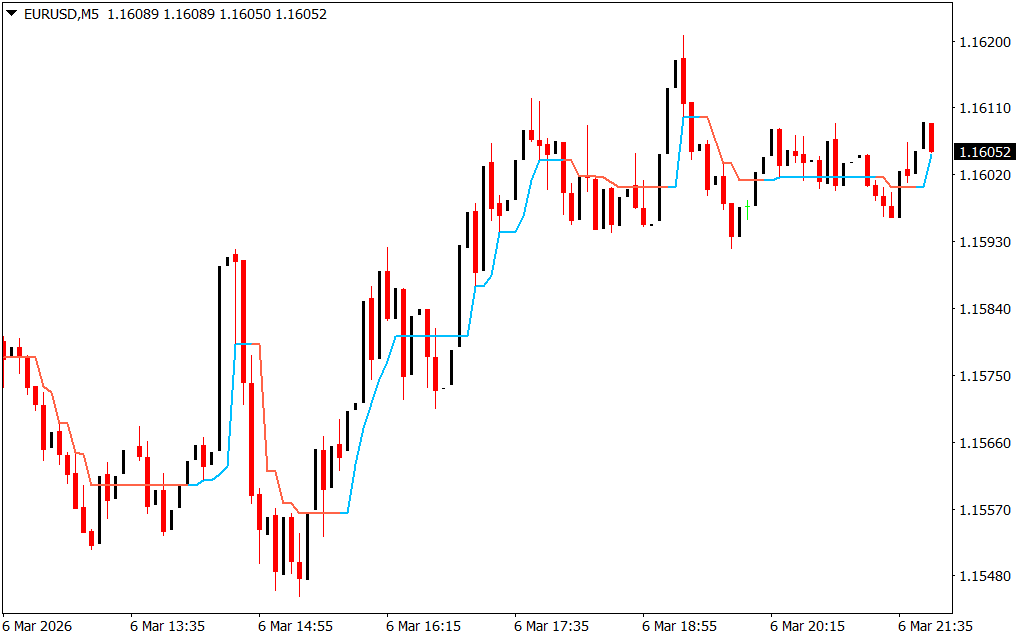
How the Half Trend Indicator Works
The indicator calculates price momentum and displays a dynamic trend line that follows the market.
When the trend direction changes, the line switches color, signaling a potential change in market momentum.
Trend Signals
- Blue signal line → Market is moving upward
- Red signal line → Market is moving downward
These color changes help traders quickly identify when to enter or exit trades.
Example Trading Setup
Consider a trading scenario on the **USD/JPY currency pair in the H4 timeframe.
Buy Setup
- The signal line changes from red to blue.
- This indicates that bearish momentum is weakening.
- Traders can consider opening a buy trade once the bullish trend is confirmed.
Sell Setup
- The signal line changes from blue to red.
- This signals a possible Trend Reversal to the downside.
- Traders may open a sell position.
Alternative Trading Strategy
The Half Trend Indicator can also be used as a trade exit tool.
For example:
- If you are in a buy trade, exit when the signal line turns red.
- If you are in a sell trade, exit when the signal line turns blue.
This approach helps traders stay in trades as long as the trend remains active.
Best Timeframes to Use
Although the indicator works on all timeframes, it generally produces more reliable signals on higher timeframes, such as:
- H1
- H4
- Daily
Higher timeframes reduce market noise and false signals.
Recommended Confirmation Indicators
To improve trading accuracy, traders often combine the Half Trend Indicator with other technical tools such as:
- Relative Strength Index (RSI)
- MACD
- Support And Resistance levels
- Price Action patterns
Using additional confirmation helps traders avoid false entries and strengthen trade setups.
Key Features of the Half Trend Indicator
- Simple color-changing trend line
- Helps identify buy and sell opportunities
- Follows price action closely
- Works on all timeframes
- Helps detect trend reversals
- Easy to use for beginner and advanced traders
- Suitable for Scalping, intraday, and swing trading
Who Should Use This Indicator?
The Half Trend Indicator is ideal for traders who want a simple trend detection tool without complicated calculations.
It is commonly used by:
- Beginner traders learning trend analysis
- Day traders identifying intraday momentum
- Swing traders capturing larger market movements
Because of its clear color signals, traders can quickly interpret market direction.
Conclusion
The Half Trend Indicator for MT4 is a straightforward trend-following tool that uses a color-changing signal line to show bullish and bearish market conditions. By watching when the line switches between blue and red, traders can identify potential entry, exit, and reversal opportunities.
When combined with price action and additional technical indicators, the Half Trend Indicator can significantly improve trend analysis and trading decisions.
FAQ
1 Download
Published:
Mar 06, 2026 16:15 PM
Category: