The FXR Forex Sentiment Indicator for MetaTrader 4 (MT4) is a powerful trading tool that analyzes buyer and seller strength in the forex market. Using a proprietary calculation method, the indicator measures the relative power of buyers and sellers, helping traders quickly identify whether the market is bullish or bearish.
By displaying real-time sentiment data, the indicator allows traders to make more informed decisions about when to enter or exit trades.
What Is the FXR Forex Sentiment Indicator?
The FXR Forex Sentiment Indicator evaluates market activity using tick data to calculate the balance between buying and selling pressure. This information is then displayed directly on the chart as percentage values representing buyer and seller strength.
Key features of the indicator include:
- Blue percentage – Represents Buyers’ Power
- Red percentage – Represents Sellers’ Power
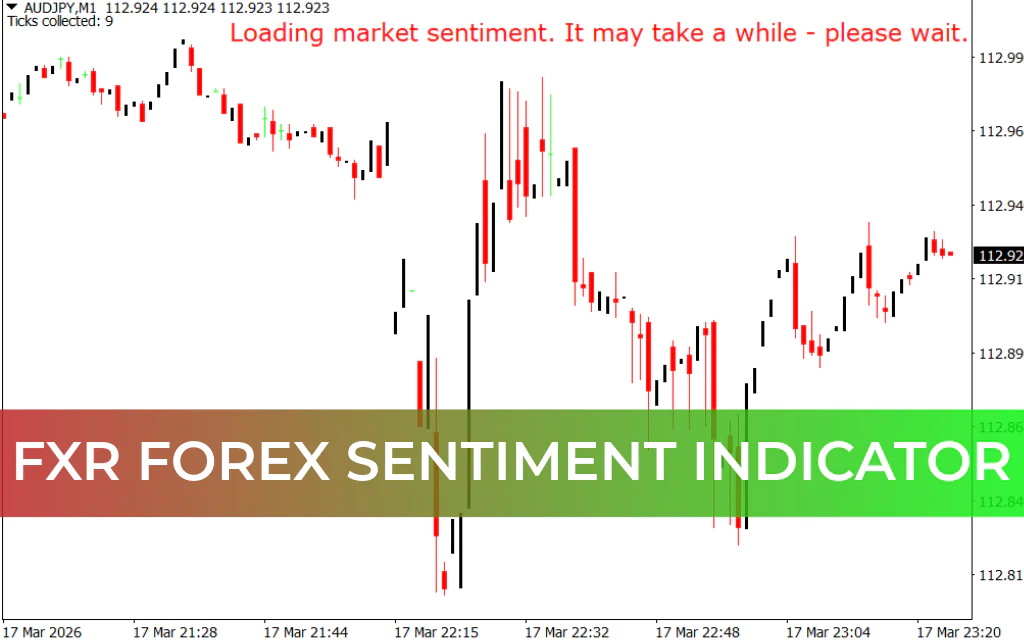
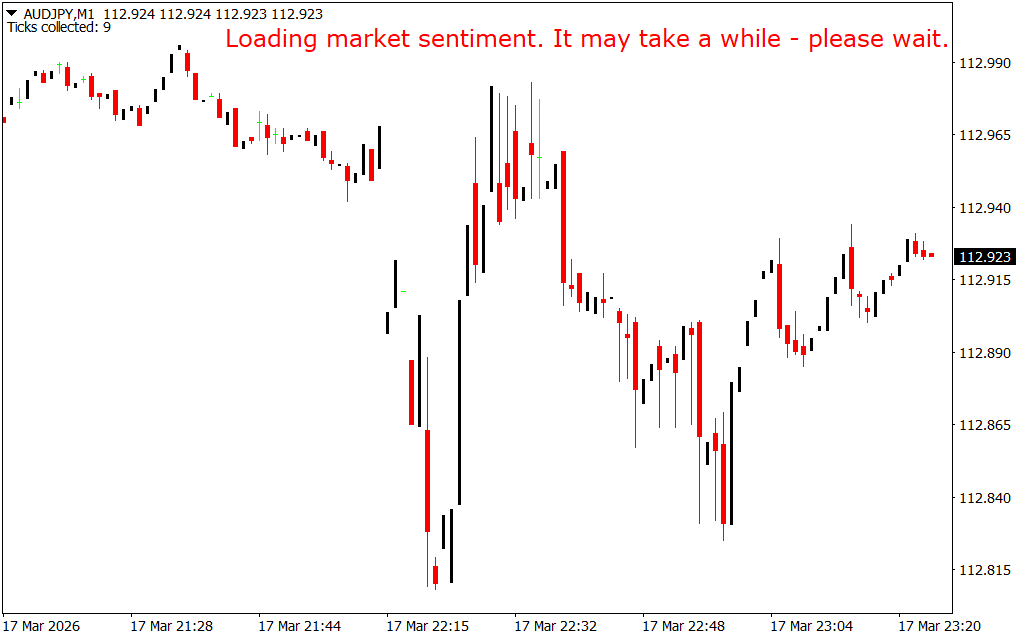
The indicator requires at least 100 ticks to calculate and display the trend direction when first loaded on a chart.
Because of its simple visual presentation, the FXR indicator is suitable for both beginner and advanced traders. Beginners can easily identify the market trend, while experienced traders can integrate the data into more advanced trading systems.
How the FXR Forex Sentiment Indicator Works
The indicator calculates the market sentiment and displays the results in real time.
For example, on a USD/CHF M15 chart, traders can see the strength of buyers and sellers directly on the screen.
The indicator’s display can be positioned in any of the four corners of the chart, depending on the trader’s preference.
Bullish Market Condition
When Buyers’ Power rises above 50%, the market is considered bullish.
Trading approach:
- Open a buy trade.
- Place a stop-loss below the previous swing low.
- Hold the position as long as buyer strength remains above 50%.
Traders can close the trade when buyer momentum begins to weaken or when a predefined risk-to-reward target is reached.
Bearish Market Condition
When Sellers’ Power rises above 50%, the market indicates a bearish trend.
Trading approach:
- Open a sell trade.
- Place a stop-loss above the previous swing high.
- Exit the trade when seller strength starts to decline.
Combining FXR Sentiment with Other Indicators
While the FXR Forex Sentiment Indicator is useful for determining the overall market trend, traders often combine it with additional technical tools for stronger signals.
For example, sentiment signals become more reliable when they occur near:
- Support And Resistance levels
- Channel lines
- Pivot levels
- Breakout zones
Traders may also confirm signals using indicators such as the Relative Strength Index or volume analysis to identify stronger trading opportunities.
Supported Timeframes
The FXR Forex Sentiment Indicator works across all trading timeframes, including:
- Intraday charts
- Daily charts
- Weekly charts
- Monthly charts
This flexibility allows traders to use the indicator for Scalping, day trading, or long-term trend analysis.
Conclusion
The FXR Forex Sentiment Indicator for MT4 is a valuable tool for identifying buyer and seller dominance in the market. By displaying market sentiment as simple percentages, it helps traders quickly determine whether the market is bullish or bearish.
When combined with support and resistance levels, volume analysis, and other technical indicators, this tool can significantly enhance market analysis and trading decision-making.
FAQ
Published:
Mar 17, 2026 18:25 PM
Category: