Free
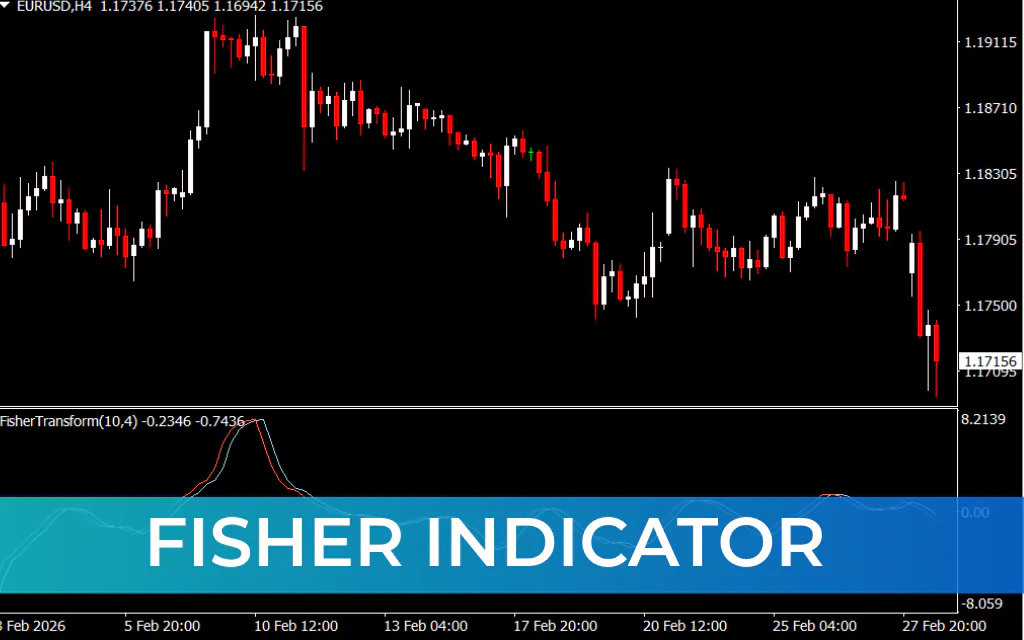
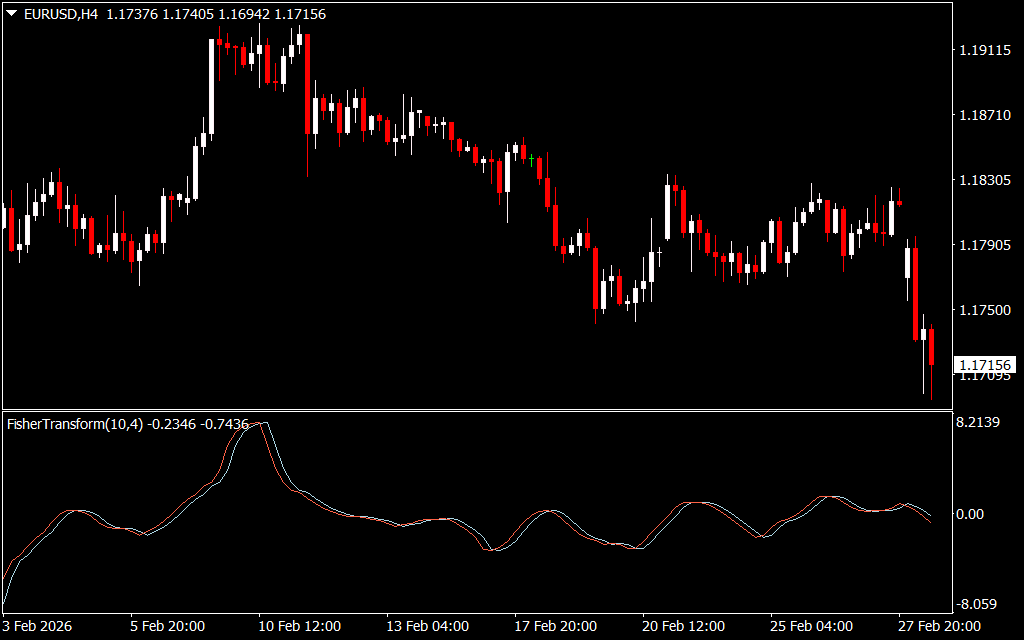
The Fisher Indicator, developed by John F. Ehlers, is a technical analysis tool designed to identify potential trend reversals in financial markets. Unlike traditional oscillators, it assumes that prices are non-linear and do not follow a normal distribution, transforming price data into a Gaussian probability distribution to highlight extreme price movements.
Key Features
- Reversal Detection:
- Identifies potential overbought and oversold conditions to anticipate trend changes.
- Gaussian Transformation:
- Converts price data into a probability distribution, enhancing the clarity of signals.
- Midpoint Price Calculation:
- Uses the average of the high and low prices to measure price changes.
- Calculates differences between current and previous midpoint prices over a defined period.
- Normalization:
- Sums the absolute differences over N periods to standardize values, making them comparable across timeframes.
- Oscillator Range:
- Fisher values oscillate roughly between -1.0 and +1.0.
How to Use the Fisher Indicator for MT4
- Overbought Condition (Sell Signal):
- Fisher value above +0.5 indicates an overbought market.
- Potential downward reversal; traders may consider a sell position.
- Oversold Condition (Buy Signal):
- Fisher value below -0.5 indicates an oversold market.
- Potential upward reversal; traders may consider a buy position.
- Confirmation:
- Combine with Price Action, support/resistance levels, or other indicators for higher accuracy.
Benefits of Using the Fisher Indicator
- Highlights extreme price movements for clearer signals.
- Useful for Trend Reversal and swing trading strategies.
- Works on any timeframe and asset class.
- Reduces false signals compared to standard oscillators by normalizing data.
Conclusion
The Fisher Indicator for MT4 is a robust tool for spotting potential market turning points. By transforming price data into a Gaussian probability distribution, it emphasizes overbought and oversold conditions, helping traders anticipate trend reversals. For best results, use in conjunction with other technical analysis tools.
FAQ
Developed by John F. Ehlers, it assumes prices are non-linear and do not follow a normal distribution. It transforms price data into a Gaussian probability distribution to highlight extreme price movements. Identifies overbought and oversold conditions to anticipate trend changes. Fisher values oscillate roughly between -1.0 and +1.0.
Reversal detection: identifies overbought/oversold. Gaussian transformation: enhances signal clarity. Midpoint price calculation: uses average of high and low. Normalization: sums absolute differences over N periods to standardize values.
Assumes non-linear prices. Gaussian transformation. Focus on extreme price movements. Comparable across timeframes.
John F. Ehlers. Uses midpoint price and normalization for clarity.
Traders identifying potential trend reversals. Those wanting Gaussian-based signals.
1 Download
Published:
Mar 02, 2026 09:50 AM
Category:
Share: