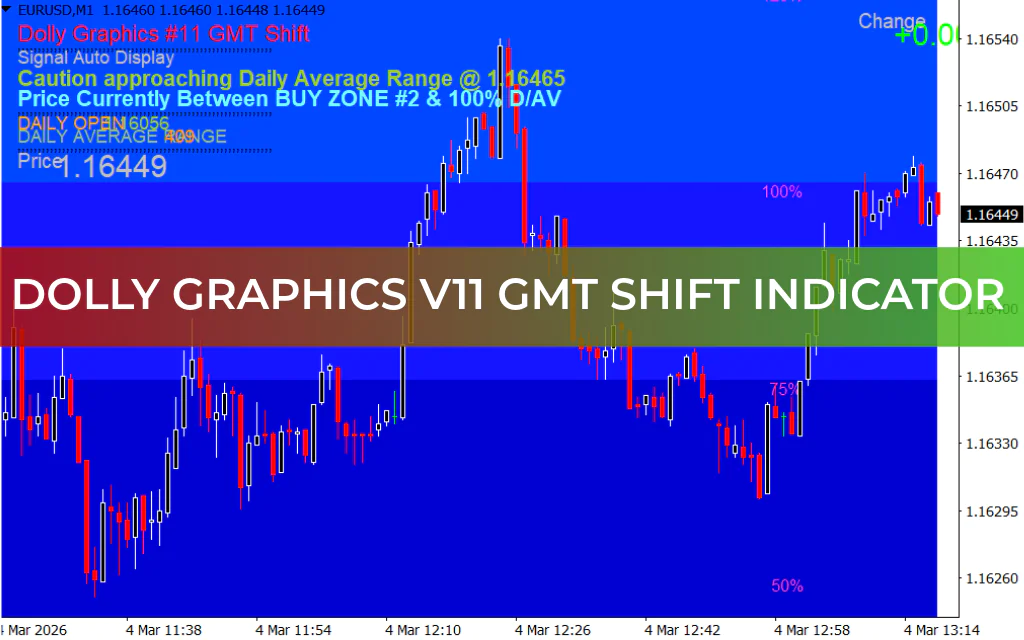
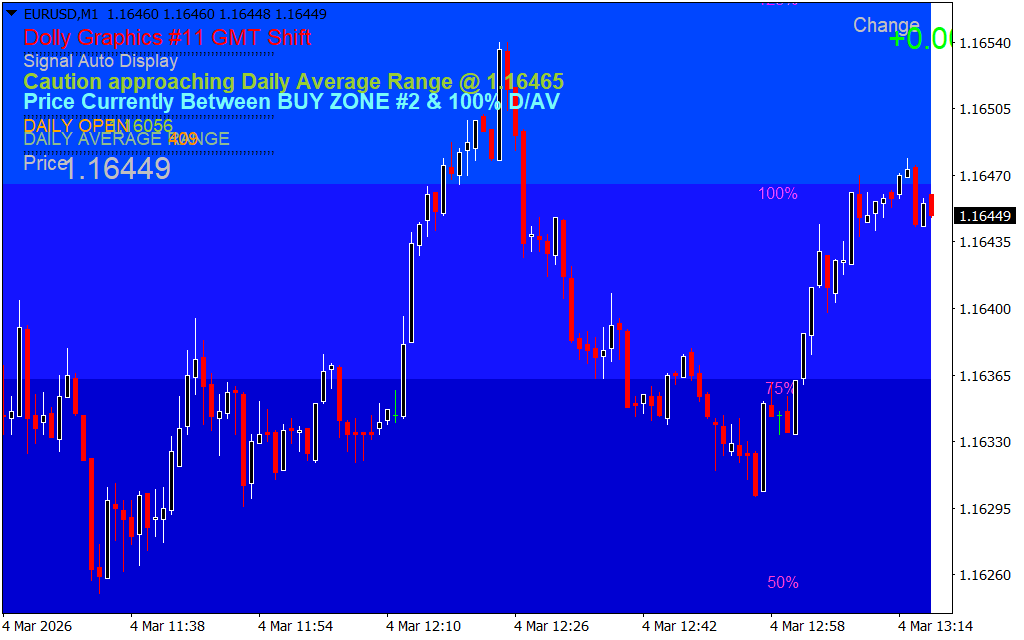
The Dolly Graphics v11 GMT Shift Indicator for MT4 is a pivot-based trading tool designed to highlight potential buy and sell zones on your chart. Using pivot points calculated from the previous day’s high, low, and close, the indicator identifies key Support And Resistance levels that traders can use to plan entries and exits.
Its color-coded system and additional GMT shift information make it a practical tool for both intraday and swing trading strategies.
Key Features of the Dolly Graphics v11 GMT Shift Indicator
- Pivot Point Analysis – Automatically calculates daily pivot points, support, and resistance levels
- Buy and Sell Zones – Color-coded for easy identification
- Blue / Dark Blue → Buy zones
- Red / Maroon → Sell zones
- Daily Open and Range Info – Helps traders assess price movement potential
- GMT Shift Display – Adjusts trading zones according to different time zones
- Visual Guidance – Simplifies trend and zone identification
These features allow traders to quickly recognize areas where price may reverse or continue, improving decision-making speed.
How to Use the Dolly Graphics v11 GMT Shift Indicator in MT4
Applied to a chart such as USD/JPY on the H4 timeframe:
- Buy Signal – When the indicator highlights a blue or dark blue zone, consider potential long positions
- Sell Signal – When the indicator highlights a red or maroon zone, consider potential short positions
Because the indicator is pivot-based, it works best when combined with other technical analysis tools like trendlines, moving averages, or oscillators. High volatility can sometimes produce false signals, so confirmation is recommended before entering trades.
Benefits of the Dolly Graphics v11 GMT Shift Indicator
- Quickly identifies potential buy and sell zones
- Color-coded for intuitive trading decisions
- Displays daily open, range, and GMT shift info
- Supports intraday and swing trading
- Works across multiple timeframes
- Beginner-friendly and easy to interpret
Conclusion
The Dolly Graphics v11 GMT Shift Indicator for MT4 is a pivot-based tool that highlights key buy and sell zones while providing daily market information and GMT shift adjustments. By analyzing these zones alongside other technical indicators, traders can improve their market timing and trade accuracy.
It is simple, visually clear, and free to download.
FAQ
Published:
Mar 04, 2026 07:19 AM
Category: