The Directional Movement Index (DMI) Indicator, developed by Welles Wilder in 1978, is a classic technical tool for identifying market trends. Unlike indicators that rely on closing prices, the DMI focuses on the highs and lows of bars, analyzing the relationship between consecutive candlesticks to determine market direction.
If the high and low of the current bar are higher than the previous bar, it signals a bullish direction.
If the high and low are lower than the previous bar, it signals a bearish direction.
How the DMI Indicator Works
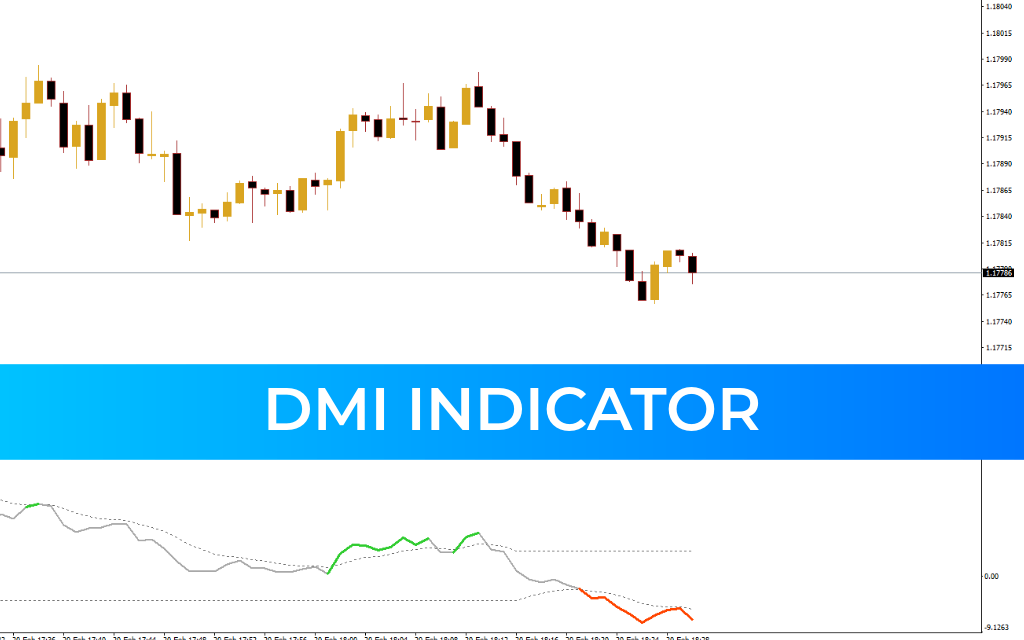
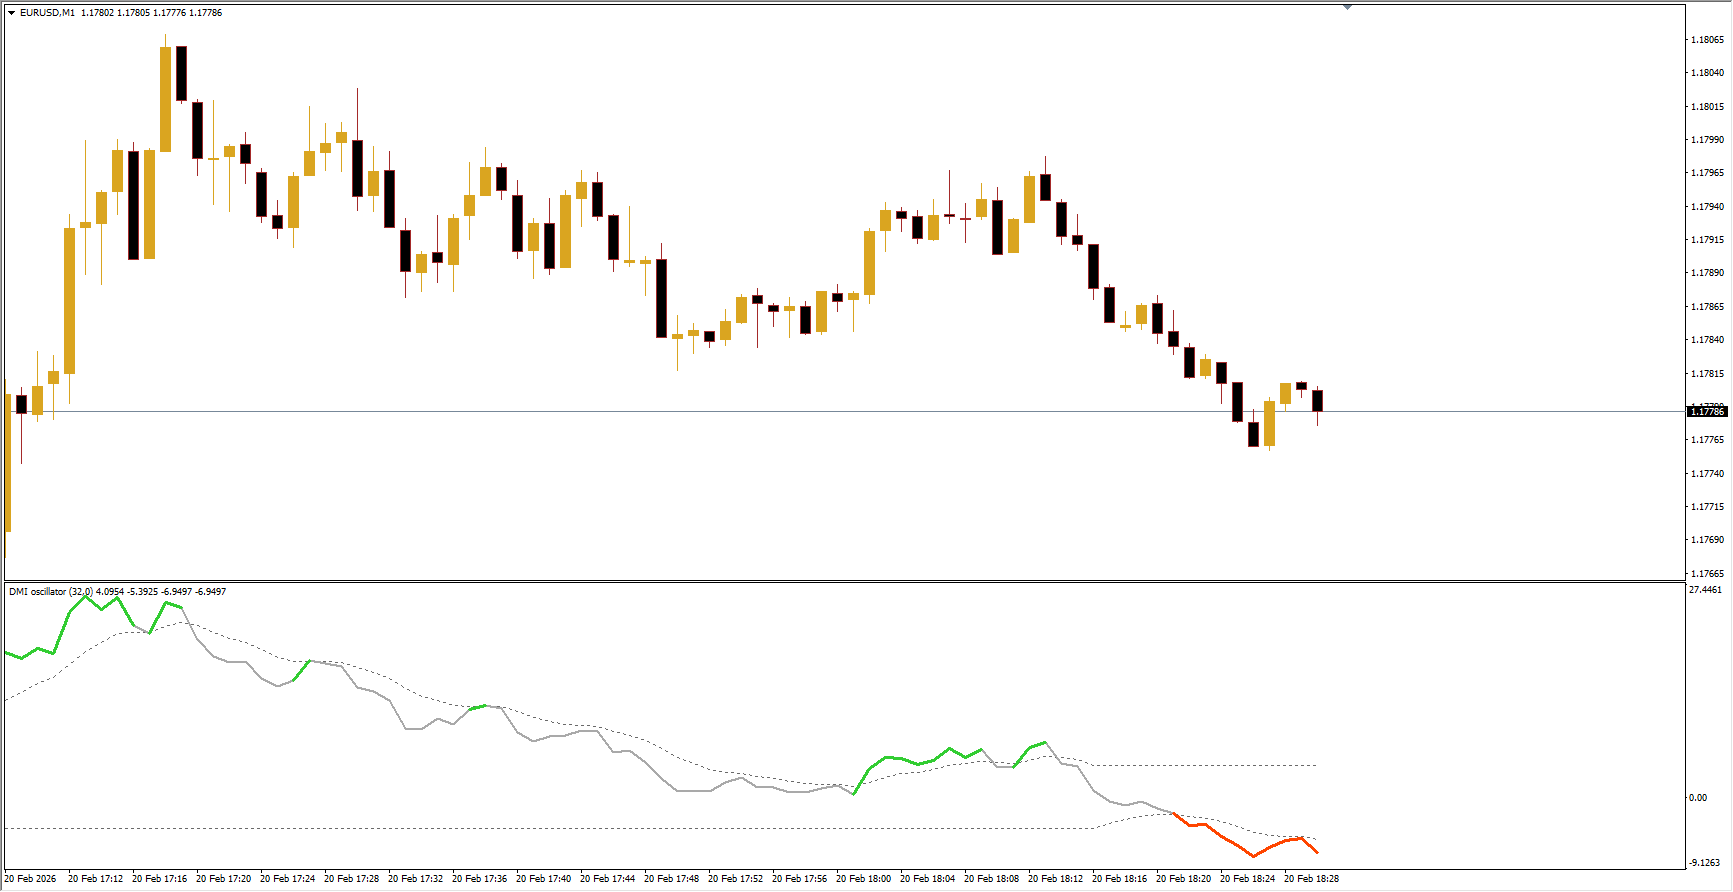
The DMI is an oscillator-style indicator and is visually intuitive, even for beginners. It uses three colors to represent different market phases:
Grey – Consolidation (sideways market)
Green – Bullish phase
Orange – Bearish phase
Some noise may appear depending on the instrument or timeframe. Adjusting the signal period, DMI period, or switching timeframes can help reduce noise and improve signal accuracy.
DMI Indicator Trading Strategy
Buy Strategy
Wait for the indicator to turn green.
Confirm that the indicator value is above zero.
Wait for a bullish candle to close.
Enter a long trade with stop-loss near the recent swing low.
Set the profit target at the next resistance level.
Sell Strategy
Wait for the indicator to turn red.
Confirm that the indicator value is below zero.
Wait for a bearish candle to close.
Enter a short trade with stop-loss near the recent swing high.
Set the profit target at the next support level.
Conclusion
The DMI indicator is a valuable tool for trend analysis and identifying potential market directions. However, it should not be used alone. Combining DMI signals with other technical indicators, Price Action analysis, or support/resistance levels can help mitigate risk and improve trading accuracy.
FAQ
Published:
Feb 20, 2026 11:32 AM
Category: