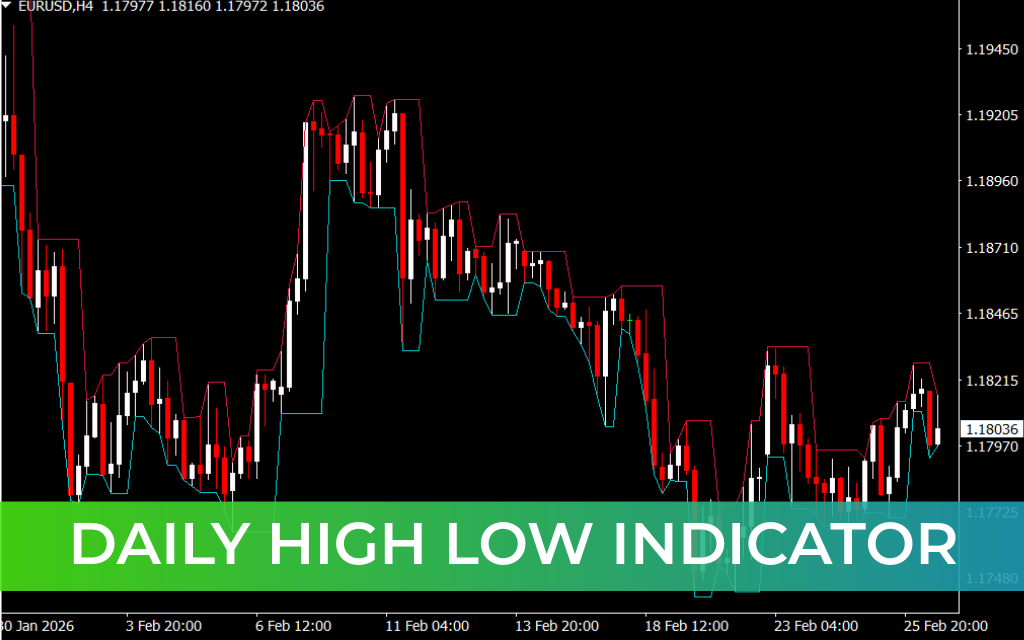
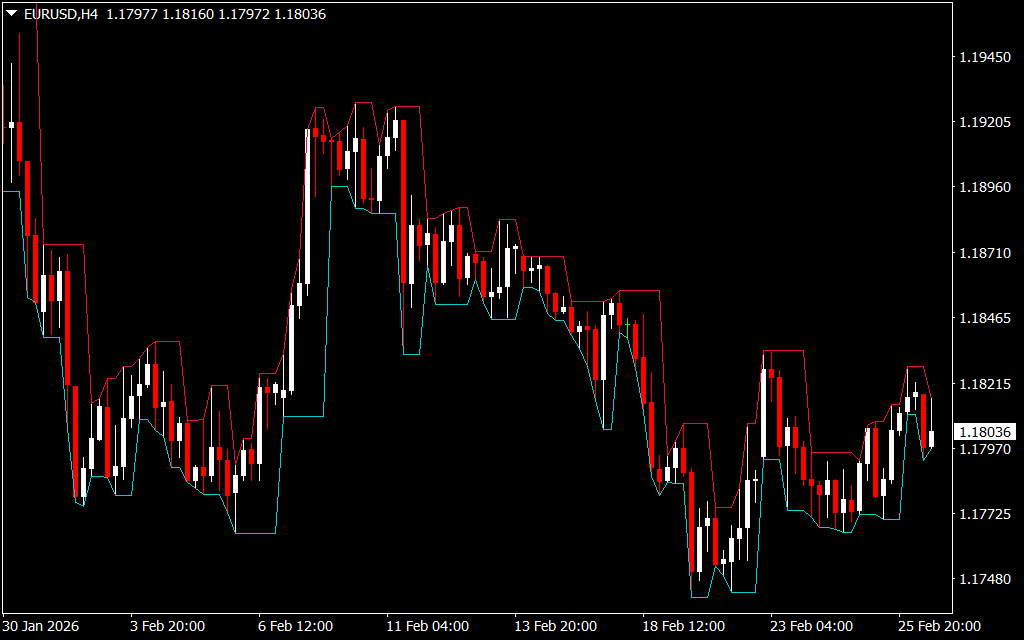
The Daily High Low Indicator for MT4 is a simple yet highly effective technical analysis tool that plots continuous lines at the previous daily high and daily low levels. Designed for the MetaTrader 4, this indicator helps Forex traders quickly identify market direction, breakout opportunities, and trend continuation setups.
By visually connecting daily highs and lows, traders gain a clearer understanding of price structure on the daily timeframe — while still viewing the levels across all chart timeframes. This makes it especially useful for both intraday and long-term traders.
How the Daily High Low Indicator Works
The indicator plots:
- Red Line – Connecting the daily high prices
- Dark Turquoise Line – Connecting the daily low prices
These dynamic levels act as key Support And Resistance zones. Traders can use them to identify breakout opportunities and trend continuation signals.
Because the lines are visible on all timeframes, they provide valuable context for lower-timeframe entries while maintaining higher-timeframe direction.
Daily High Low Trading Strategy
There are multiple ways to trade using this indicator. The most popular approach focuses on trend structure and breakouts.
Bullish Setup
- Price forms higher highs and higher lows.
- The current price breaks above the previous day’s high.
- The current day’s low remains higher than the previous day’s low.
Entry:
- Enter a buy position after the breakout.
- Place a stop loss below the previous day’s low.
This setup confirms bullish momentum and potential trend continuation.
Bearish Setup
- Price forms lower highs and lower lows.
- The current price breaks below the previous day’s low.
Entry:
- Enter a sell position after the breakout.
- Place a stop loss above the previous day’s high.
This confirms bearish strength and downside continuation potential.
Key Features and Benefits
1. Clear Breakout Levels
Instantly identify previous daily high and low zones.
2. Multi-Timeframe Visibility
Works across all chart timeframes for better trade timing.
3. Trend Confirmation
Helps validate bullish or bearish Market Structure.
4. Simple & Effective
Beginner-friendly while remaining valuable for advanced traders.
5. Ideal for Intraday & Swing Trading
Perfect for breakout traders and trend followers.
Why Use the Daily High Low Indicator for MT4?
Daily highs and lows are among the most respected support and resistance levels in Forex trading. Institutional traders and professional analysts closely monitor these levels for breakout confirmation and trend continuation.
This indicator simplifies the process by automatically plotting and maintaining those key levels — helping traders stay aligned with the daily market direction.
Conclusion
The Daily High Low Indicator for MT4 is a straightforward yet powerful tool for identifying daily trends and breakout opportunities. By highlighting key price levels, it enables traders to trade in the direction of the dominant daily trend with clear risk management rules. Download the Daily High Low Indicator today to improve your breakout strategy and strengthen your trend-based trading decisions.
FAQ
1 Download
Published:
Feb 26, 2026 09:11 AM
Category: