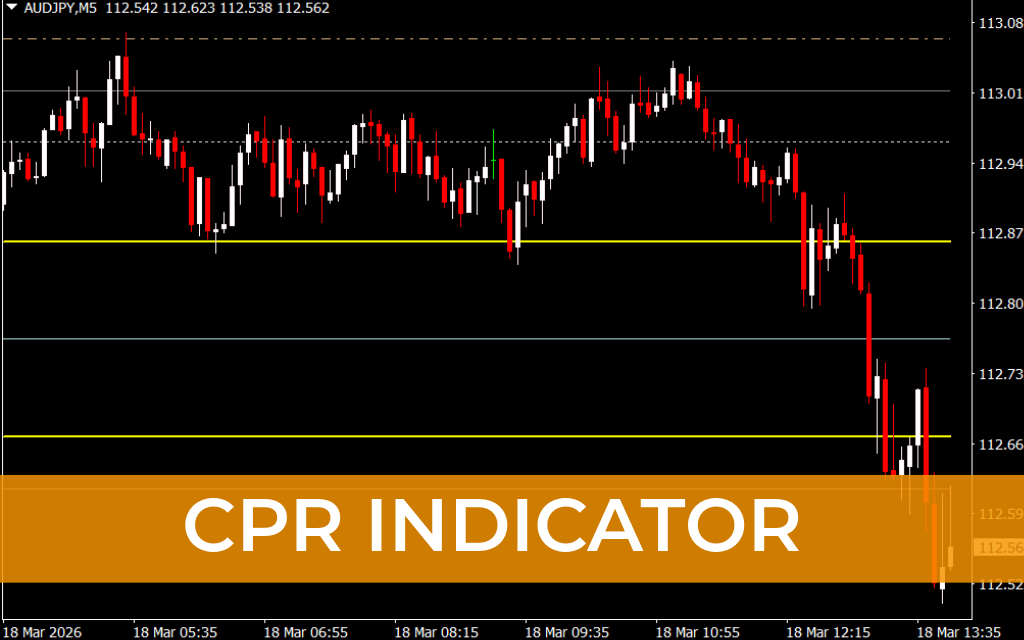
The CPR Indicator for MT4 (Central Pivot Range) is an advanced pivot point tool used by traders to analyze daily price levels, market sentiment, and potential Support And Resistance zones. Pivot-based strategies are widely used in Forex and stock markets, particularly by day traders and intraday traders, because they help identify critical price areas where the market may reverse or continue trending.
The CPR indicator builds on the traditional pivot point concept but enhances it by introducing a central pivot range, which provides deeper insights into market momentum and price direction.
Instead of generating direct buy or sell signals, the indicator highlights key decision zones in the market, where supply and demand shifts are likely to occur. Traders can then use these levels alongside Price Action signals to identify high-probability trading opportunities.
What Is the Central Pivot Range (CPR)?
The Central Pivot Range (CPR) consists of three main pivot levels that form a zone on the chart:
- Central Pivot (PV)
- Top Central Pivot (TC)
- Bottom Central Pivot (BC)
These levels create a range that helps traders determine whether the market sentiment is bullish, bearish, or neutral.
The CPR indicator also plots additional support and resistance levels based on daily, weekly, and monthly price data, giving traders a broader view of potential market turning points.
How the CPR Indicator Works
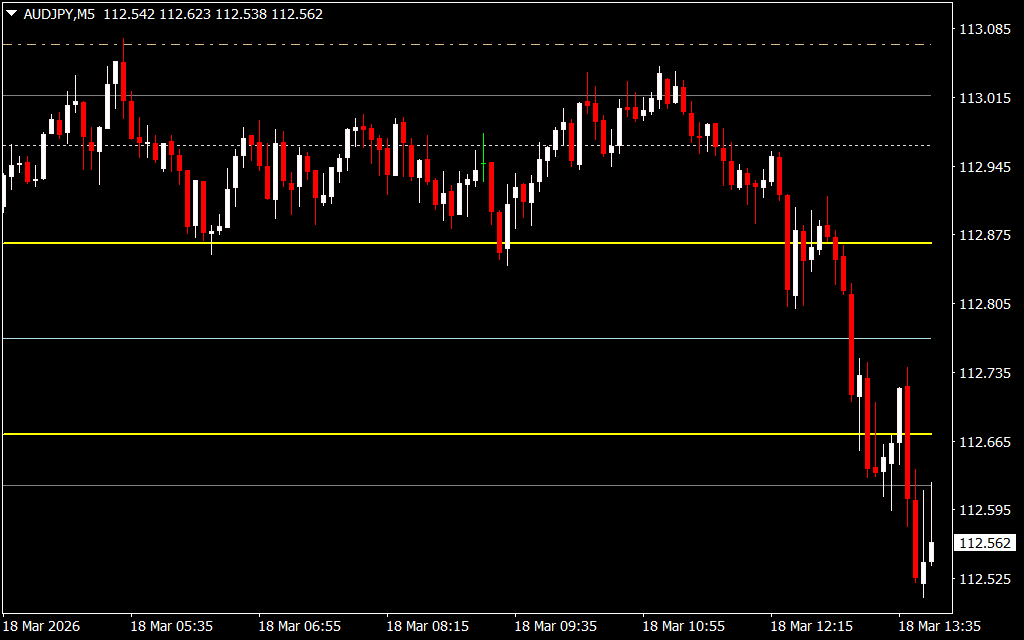
When applied to a chart, the CPR indicator automatically calculates pivot levels and displays them as horizontal lines.
These lines help traders identify:
- Market sentiment
- Potential breakout zones
- Key support and resistance areas
- Possible profit targets and stop-loss zones
By observing how the price reacts around these pivot levels, traders can anticipate the next potential market move.
Understanding the CPR Levels
Central Pivot (PV)
The Central Pivot is the most important level in the CPR indicator. It acts as a reference point to determine the overall market bias.
- If the price stays below the central pivot, the market tends to be bearish.
- If the price stays above the central pivot, the market tends to be bullish.
When the price moves around this level, traders often watch closely for breakout or reversal signals.
Top Central Pivot (TC)
The Top Central Pivot (TC) represents the upper boundary of the pivot range.
If the price moves above the TC level, it indicates strong buying pressure, suggesting the market may continue moving upward.
In such situations, traders may look for buy opportunities, especially if other confirmation signals appear.
Bottom Central Pivot (BC)
The Bottom Central Pivot (BC) forms the lower boundary of the pivot range.
If the price moves below the BC level, it signals increasing selling pressure, which may lead to a downward price movement.
This scenario may present sell opportunities for traders following bearish momentum.
Using CPR for Trade Management
In addition to identifying potential entry zones, the CPR indicator also helps traders manage trades effectively.
Setting Take Profit
Support and resistance levels plotted by the CPR indicator can act as profit targets.
For example:
- The next resistance level may be used as a take-profit point for buy trades.
- The next support level may serve as a target for sell trades.
Setting Stop Loss
Traders often place stop-loss orders just beyond the pivot range or near nearby support and resistance levels to limit risk.
Why Traders Use the CPR Indicator
The CPR indicator offers several advantages for technical traders:
- Identifies important market decision zones
- Helps determine market sentiment
- Displays dynamic support and resistance levels
- Supports daily, weekly, and monthly analysis
- Suitable for day trading and intraday strategies
Because of its simplicity and effectiveness, the indicator is especially helpful for traders who find it difficult to manually calculate pivot points.
Important Trading Tip
While the CPR indicator is useful for identifying key price levels, it does not generate direct buy or sell signals. Traders should combine it with other technical tools for confirmation.
Common confirmation tools include:
- Candlestick patterns
- Trendlines
- Moving averages
- Momentum indicators
Using multiple indicators together can significantly improve trading accuracy.
Conclusion
The CPR Indicator for MT4 offers a powerful yet simple way to analyze pivot levels and identify important support and resistance zones. By using the Central Pivot, Top Central Pivot, and Bottom Central Pivot, traders can better understand market sentiment and anticipate possible price movements.
Although pivot levels alone may not be sufficient for executing trades, combining the CPR indicator with other technical analysis tools can greatly improve trading decisions.
For traders who want a reliable way to track daily support and resistance levels in MetaTrader 4, the CPR indicator is a valuable addition to any trading setup.
FAQ
3 Downloads
Published:
Mar 18, 2026 08:59 AM
Category: