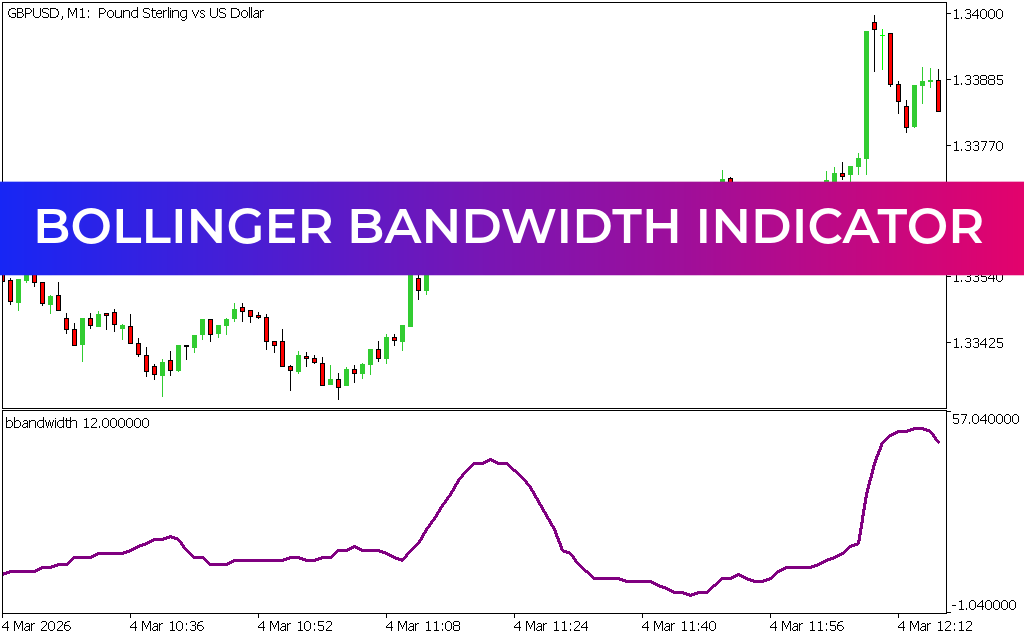
The Bollinger Bandwidth Indicator for MT5 is a powerful volatility measurement tool based on the classic Bollinger Bands. Instead of showing price direction, it measures the distance between the upper and lower Bollinger Bands, helping traders understand market volatility conditions.
When volatility increases, the bands expand. When volatility decreases, the bands contract. The Bollinger Bandwidth Indicator converts this behavior into an oscillator for easier analysis.
What is the Bollinger Bandwidth Indicator?
The Bollinger Bandwidth Indicator is derived from Bollinger Bands and measures the width between the upper and lower bands.
- Wide bands → High volatility
- Narrow bands → Low volatility
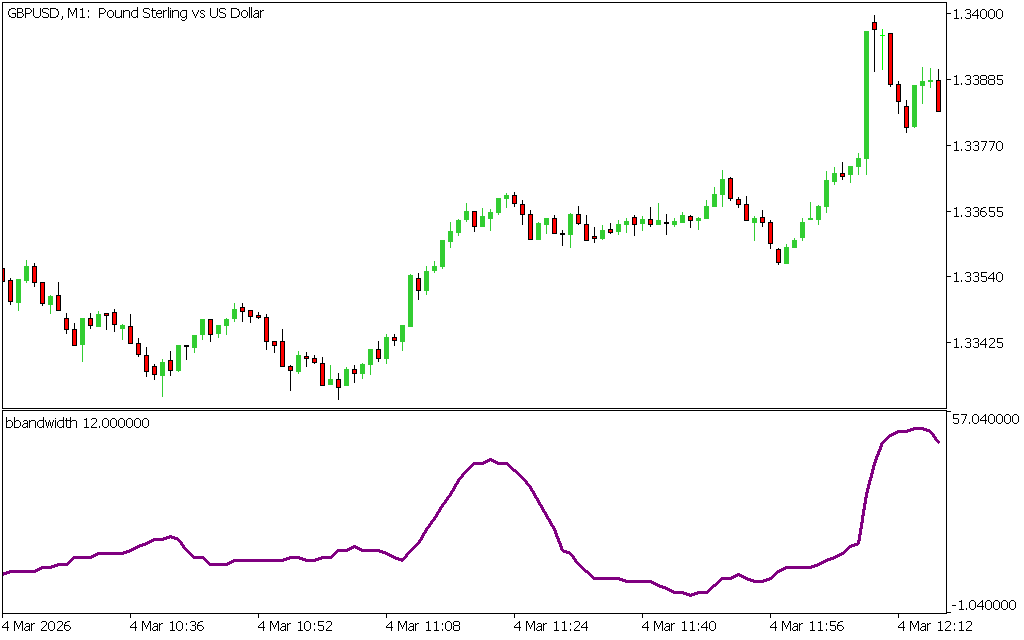
It is displayed in a separate indicator window as an oscillator, making it easy to monitor volatility shifts.
How Does the Bollinger Bandwidth Indicator Work?
The indicator increases or decreases based on market volatility:
- Increasing value → Market volatility is rising
- Decreasing value → Market volatility is falling
A key concept behind this indicator is that:
Periods of low volatility are often followed by strong price movements.
Key Features of Bollinger Bandwidth Indicator
- Measures market volatility strength
- Works as an oscillator in a separate window
- Suitable for all timeframes (M1 to Monthly)
- Works for Scalping, day trading, and swing trading
- Helps anticipate breakouts and major moves
How to Trade with Bollinger Bandwidth Indicator
The Bollinger Bandwidth Indicator does not show direction. Instead, it helps traders prepare for potential breakout opportunities.
1. Volatility Expansion Strategy
- When the indicator is very low, volatility is compressed
- This often signals an impending strong price move
- Traders should prepare for breakout setups
2. Breakout Trading Setup
Once volatility begins to rise:
- Confirm direction using Price Action
- Enter trades in the direction of breakout momentum
Example:
- Low bandwidth → market consolidation
- Sudden increase → breakout begins
3. Pattern-Based Strategy
Traders can also use oscillator patterns:
- Double bottom in oscillator → Potential BUY setup
- Double top in oscillator → Potential SELL setup
Stop-loss is typically placed beyond the recent swing in price structure.
4. Divergence Strategy
Divergence between price and bandwidth can indicate:
- Weakening momentum
- Upcoming volatility expansion
- Possible reversal or breakout conditions
Important Notes
- The indicator does not provide buy or sell signals
- It does not show trend direction
- It must be used with price action or other indicators
- Best results occur in combination with breakout strategies
Who Should Use This Indicator?
The Bollinger Bandwidth Indicator is ideal for:
- Scalpers looking for breakout setups
- Intraday traders monitoring volatility changes
- Swing traders preparing for major market moves
- Beginners learning volatility-based trading
Key Benefits
- Detects low and high volatility zones
- Helps anticipate major market breakouts
- Works across all trading timeframes
- Improves timing of trade entries
- Easy to interpret and use
Conclusion
The Bollinger Bandwidth Indicator for MT5 is an essential volatility analysis tool that helps traders anticipate major market moves by measuring changes in Bollinger Bands width. While it does not provide direct trading signals, it is extremely valuable for identifying breakout conditions and market compression phases.
For best results, it should be combined with price action and directional indicators.
Best of all, the Bollinger Bandwidth Indicator is completely free to download, making it a useful addition to any trading strategy.
Published:
Apr 11, 2026 05:09 AM
Category: