The Bands Fibo True Indicator for MT4 is an advanced variation of the classic Bollinger Bands tool, designed to enhance trading accuracy using Fibonacci ratios instead of standard deviation. By integrating key Fibonacci levels into band calculations, this indicator provides traders with more precise zones for identifying overbought and oversold conditions.
Ideal for both beginners and experienced traders, this indicator helps improve decision-making by combining volatility analysis with Fibonacci-based Market Structure.
What is the Bands Fibo True Indicator?
Unlike traditional Bollinger Bands, which rely on standard deviation, the Bands Fibo True Indicator uses the following Fibonacci ratios:
- 1.618 (Inner Bands)
- 2.618 (Middle Bands)
- 4.236 (Outer Bands)
These levels are automatically plotted above and below the price, creating dynamic Support And Resistance zones that reflect potential reversal points.
How the Indicator Works
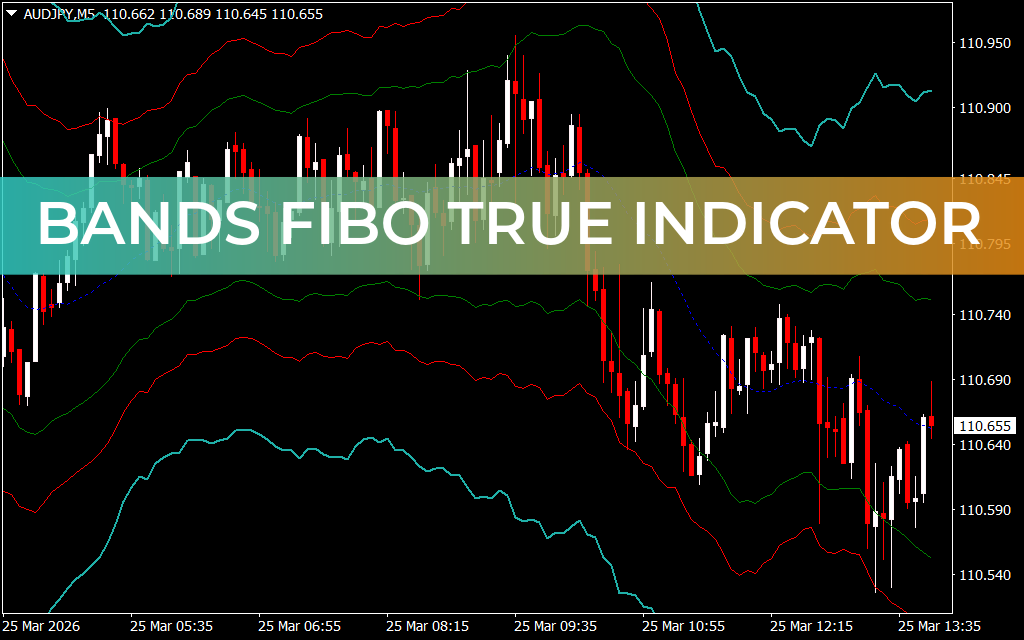
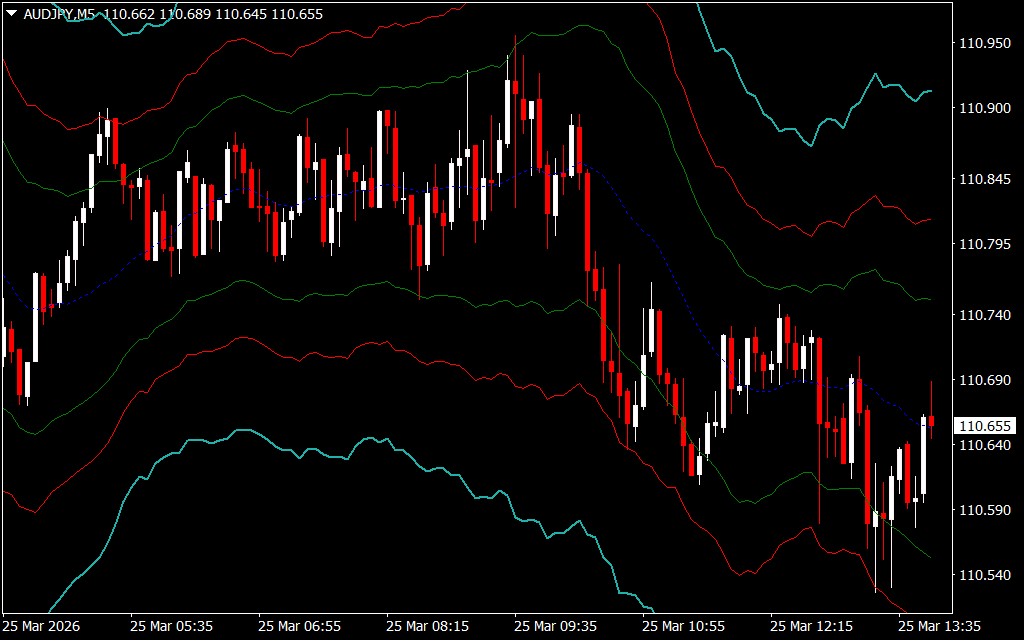
The indicator displays six bands in total:
- Outer Bands (Light Green – 4.236): Extreme overbought/oversold zones
- Middle Bands (Red – 2.618): Strong reversal zones
- Inner Bands (Green – 1.618): Confirmation levels for trade entries
This layered structure allows traders to better understand price behavior and identify high-probability reversal setups.
Key Features
- Uses Fibonacci ratios instead of standard deviation
- Plots multiple dynamic support and resistance levels
- Identifies overbought and oversold market conditions
- Suitable for all timeframes and trading styles
- Works well with automated trading systems
- Can be combined with other technical indicators for higher accuracy
Trading Strategy and Signals
The Bands Fibo True Indicator follows principles similar to Bollinger Bands trading but with enhanced precision:
Sell Setup (Bearish Reversal)
- Price reaches the middle (2.618) or outer band (4.236)
- Market is considered overbought
- Wait for price to reverse and close below the inner band (1.618)
- Enter a sell trade
- Place stop-loss above the previous swing high
- Take profit near the opposite band
Buy Setup (Bullish Reversal)
- Price reaches the middle or outer lower band
- Market is considered oversold
- Wait for price to reverse and close above the inner band
- Enter a buy trade
- Place stop-loss below the previous swing low
- Target the opposite band for profit
Best Practices for Trading
- Learn Bollinger Band Basics: Understanding classic band behavior improves results
- Wait for Confirmation: Avoid entering trades without inner band confirmation
- Combine Indicators: Use RSI, MACD, or Price Action for stronger signals
- Apply Risk Management: Always use stop-loss and proper position sizing
- Backtest First: Test the strategy on different pairs and timeframes
Why Use the Bands Fibo True Indicator?
This indicator offers a unique edge by combining the power of Fibonacci ratios with volatility-based trading. It provides clearer reversal zones compared to traditional Bollinger Bands, making it especially useful for traders looking to refine their entry and exit timing.
Conclusion
The Bands Fibo True Indicator for MT4 is a powerful alternative to standard Bollinger Bands, delivering enhanced precision through Fibonacci-based calculations. When used with proper confirmation and risk management, it can significantly improve your ability to identify profitable reversal opportunities in the Forex market.
FAQ
4 Downloads
Published:
Mar 25, 2026 09:00 AM
Category: