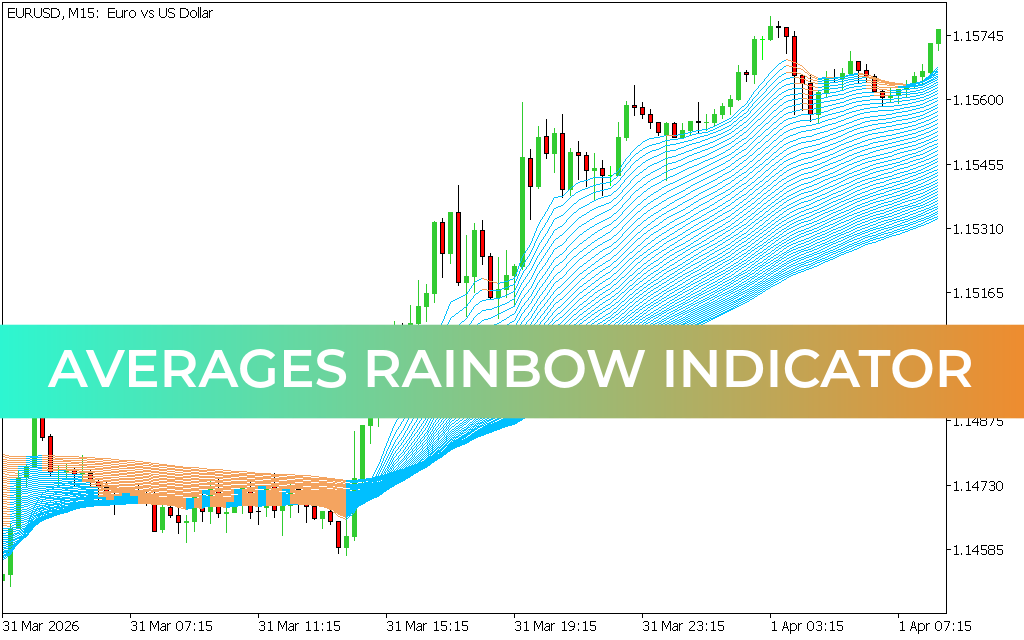
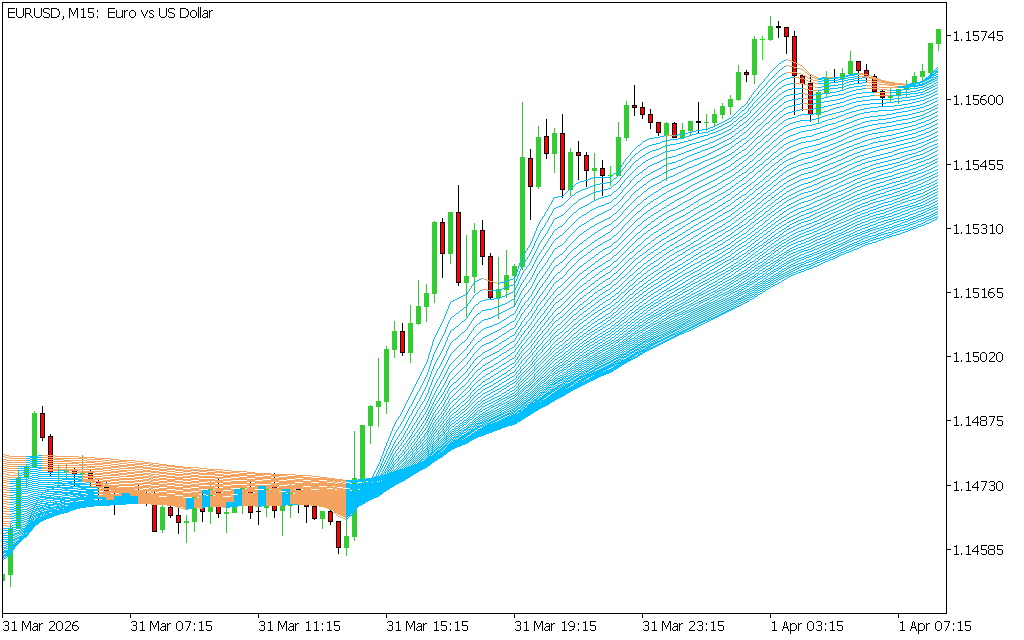
The Averages Rainbow Indicator for MT5 is a visually powerful tool made up of multiple moving averages that help traders identify market trends, reversals, and key trading opportunities. By displaying a “rainbow” of moving averages on the chart, it provides a clear view of price direction and momentum.
This indicator is ideal for both beginners and advanced traders, offering simple signals for new users while allowing experienced traders to integrate it into more complex strategies.
What is the Averages Rainbow Indicator?
The Averages Rainbow Indicator consists of a series of moving averages (often up to 50) layered on the chart. These lines form a colorful band—or “rainbow”—that reflects the strength and direction of the trend.
- Outer lines → Key entry and exit signals
- Inner lines → Trend Strength and structure
Together, they act as dynamic support and resistance levels, helping traders understand how price behaves within a trend.
Key Features
- Combines multiple moving averages into one indicator
- Clearly shows bullish and bearish trends
- Identifies trend reversals early
- Works on all timeframes (intraday to long-term)
- Suitable for beginners and advanced traders
- Supports multi-timeframe (MTF) strategies
How the Averages Rainbow Indicator Works
The indicator displays a layered structure of moving averages:
- Blue upper band → Resistance zone in bullish conditions
- Orange lower band → Support zone in bearish conditions
The spacing and direction of these lines indicate trend strength:
- Wide, expanding rainbow → Strong trend
- Tight, compressed rainbow → Weak or ranging market
Trading Signals
Buy Signal (Bullish Trend)
- Price closes above the upper blue moving average band
- Indicates the start of an uptrend
- Enter a BUY trade
- Place stop loss below the previous swing low
- Exit when an opposite signal appears
Sell Signal (Bearish Trend)
- Price closes below the lower orange moving average band
- Signals the beginning of a downtrend
- Enter a SELL trade
- Set stop loss above the previous swing high
- Take profit when the trend reverses
Multi-Timeframe Strategy
One of the biggest advantages of this indicator is its flexibility across timeframes:
- Use higher timeframes (daily/weekly) to identify the main trend
- Use lower timeframes (5-min/15-min) to fine-tune entry points
This approach helps traders align with stronger trends while optimizing entry precision.
Trading Example
On a GBP/USD chart:
- Price breaks above the upper rainbow → Buy signal
- The rainbow expands → strong bullish momentum
- Price remains above inner moving averages → Trend Confirmation
Later:
- Price drops below the lower band → Sell signal
- Trend reverses → opportunity to switch positions
Why Use the Averages Rainbow Indicator?
This indicator helps traders:
- Instantly identify trend direction
- Understand market strength visually
- Improve entry and exit timing
- Trade confidently using structured signals
It simplifies complex moving average strategies into a clean, easy-to-read format.
Conclusion
The Averages Rainbow Indicator for MT5 is an excellent choice for trend-following strategies. It combines clarity, flexibility, and powerful insights into one tool.
Whether you're a beginner learning trend trading or an advanced trader refining strategies, this indicator can significantly improve your market analysis and trading performance.
4 Downloads
Published:
Apr 12, 2026 08:49 AM
Category: