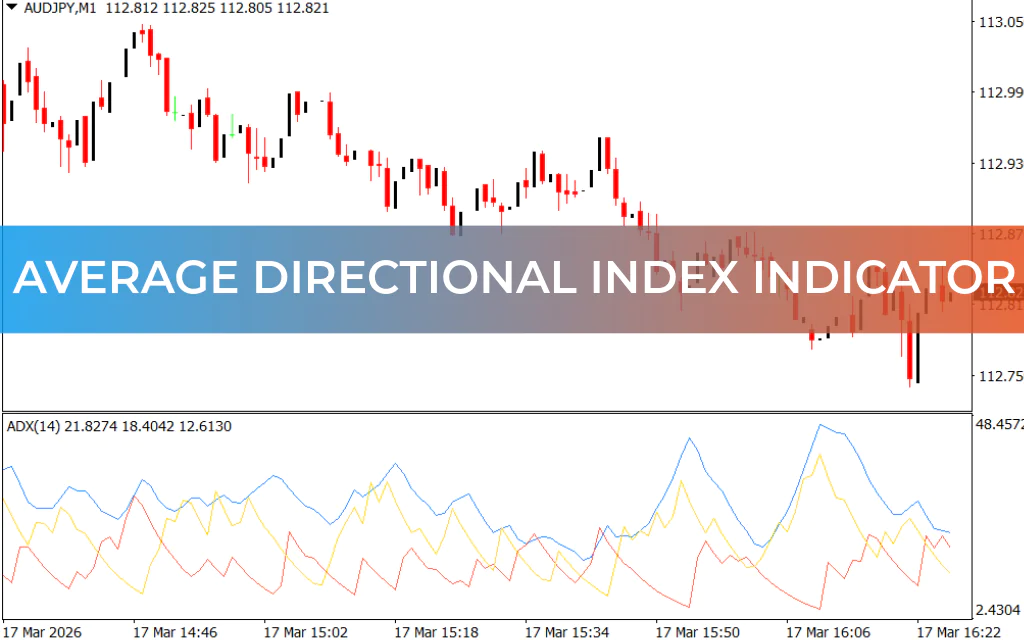
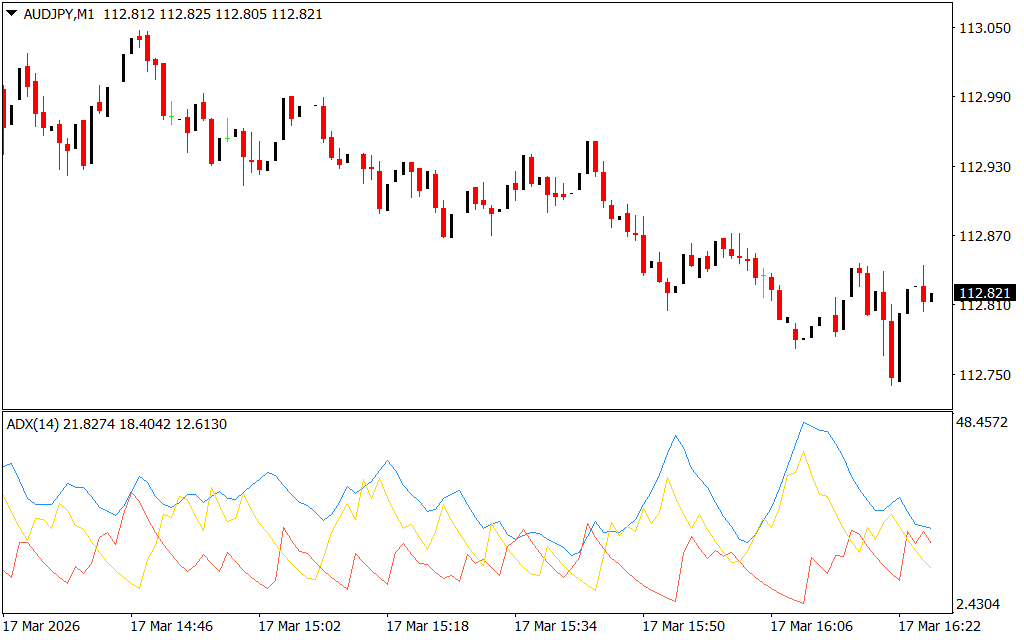
The Average Directional Index (ADX) is a technical indicator designed to measure the strength of a trend, regardless of its direction. Developed by J. Welles Wilder in his book New Concepts in Technical Trading Systems, the ADX helps traders determine whether a market is trending and how strong that trend is.
What is the ADX Indicator?
The ADX indicator is composed of three lines:
- ADX line – Shows the strength of the trend on a scale from 0 to 100.
- ADX > 25 → Strong trend
- ADX < 20 → Weak or no trend
- +DI line (Positive Directional Indicator) – Measures the strength of upward price movement.
- –DI line (Negative Directional Indicator) – Measures the strength of downward price movement.
The ADX is non-directional, meaning it only measures Trend Strength, not the trend’s direction.
How the ADX Indicator Works
- Trend Strength:
- Rising ADX → Trend is gaining strength
- Falling ADX → Trend is weakening or ending
- Directional Signals:
- +DI above –DI and ADX > 25 → Buy signal, indicating a strong upward trend
- –DI above +DI and ADX > 25 → Sell signal, indicating a strong downward trend
- Avoiding Trades:
- ADX below 20 → Market is ranging or trendless, so trend-following strategies may not work
ADX Trading Strategy
Buy Setup
- +DI crosses above –DI
- Wait for Price Action confirmation (bullish candlestick patterns, breakouts, etc.)
- Place stop-loss near the recent swing low
- Exit when trend changes or +DI dips below –DI
Sell Setup
- –DI crosses above +DI
- Wait for price action confirmation (bearish candlestick patterns, breakouts, etc.)
- Set stop-loss near the recent swing high
- Exit when trend changes or –DI dips below +DI
Tips for Using ADX Effectively
- Combine with other indicators: Use moving averages, RSI, or support/resistance zones for Trend Confirmation.
- Use higher timeframes for trend strength analysis and lower timeframes for precise entry points.
- Avoid trading in low ADX conditions (below 20) as trend-following strategies are less effective.
Pros and Cons
✅ Pros:
- Clearly identifies trend strength
- Helps filter ranging vs trending markets
- Can be combined with DI crossovers for buy/sell signals
❌ Cons:
- ADX does not indicate trend direction on its own
- Signals may lag in very fast-moving markets
- Works best with other confirmation tools
Conclusion
The ADX indicator is a reliable tool for assessing trend strength. By combining the ADX with +DI/–DI crossovers and price action confirmation, traders can identify strong trends and optimize entry and exit points. Like all indicators, ADX is most effective when used alongside other technical tools.
FAQ
Published:
Mar 17, 2026 11:28 AM
Category: