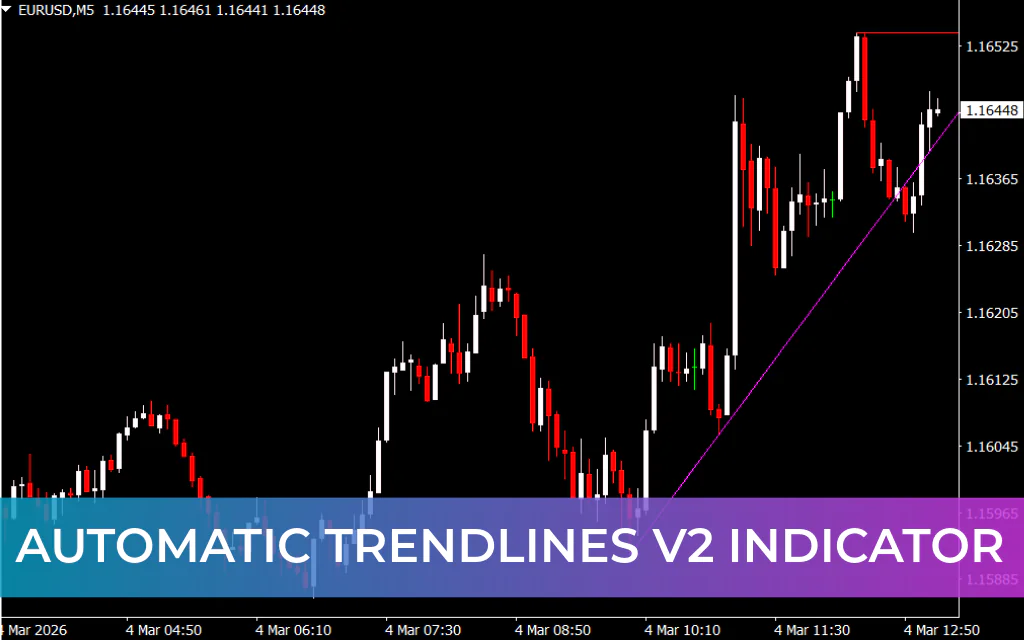
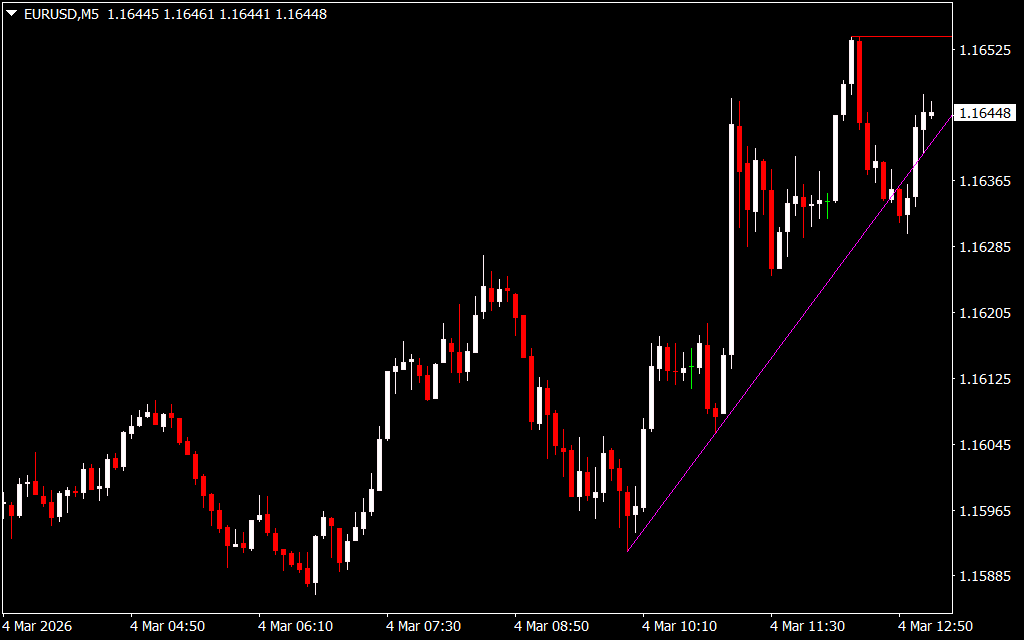
The Automatic Trendlines V2 Indicator for MetaTrader 4 is a powerful charting tool that automatically plots trendlines, helping traders identify market trends without manually drawing them. Unlike the standard MT4 trendline tool, this indicator uses advanced algorithms to scan historical price data, detect swing highs and lows, and draw accurate trendlines that reflect the underlying market direction.
It works across all timeframes, though longer timeframes provide more reliable trend analysis.
Key Features of the Automatic Trendlines V2 Indicator
- Automatic Trendline Plotting – Draws bullish and bearish trendlines automatically
- Color-Coded Lines –
- Magenta line → Bullish trend (acts as support)
- Red line → Bearish trend (acts as resistance)
- Swing Highs & Lows Detection – Identifies significant price points to define trends
- Support & Resistance Levels – Trendlines can act as dynamic Support And Resistance
These features simplify trend identification and provide visual guidance for market analysis.
How to Use the Automatic Trendlines V2 Indicator in MT4
Applied to a chart like EUR/CAD on the H4 timeframe, the indicator plots two main lines:
- Red Bearish Line – Sloping downward indicates a bearish trend; acts as a resistance level
- Magenta Bullish Line – Sloping upward indicates a bullish trend; acts as a support level
Traders can use these trendlines to:
- Determine the overall trend direction
- Spot trend continuation opportunities
- Identify potential market reversal zones
For more precise trading, combine the indicator with other tools such as Moving Averages, RSI, or MACD to confirm trade entries and exits.
Benefits of Using Automatic Trendlines V2
- Saves time by automating trendline plotting
- Provides clear visual trend guidance
- Identifies support and resistance levels
- Works on all timeframes and instruments
- Suitable for both beginners and advanced traders
Conclusion
The Automatic Trendlines V2 Indicator for MT4 simplifies trend analysis by automatically drawing bullish and bearish trendlines. These lines act as dynamic support and resistance, helping traders identify trend continuation and potential market reversals.
It is easy to use, visually intuitive, and free to download.
FAQ
2 Downloads
Published:
Mar 04, 2026 07:13 AM
Category: