he ADX Crossing Indicator for MT4 is a simplified version of the well-known Average Directional Index. It helps traders easily determine both the strength and direction of a market trend without dealing with the complexity of the traditional ADX components.
In the standard ADX system, traders must analyze the interaction between +DI and −DI lines, which can sometimes be confusing—especially for beginners. The ADX Crossing Indicator simplifies this process by generating clear buy and sell signals directly on the chart.
Instead of interpreting multiple lines, traders simply watch for colored dots that indicate potential trading opportunities.
How the ADX Crossing Indicator Works
The indicator analyzes Trend Strength using the logic behind the Average Directional Index and converts it into easy-to-read signals.
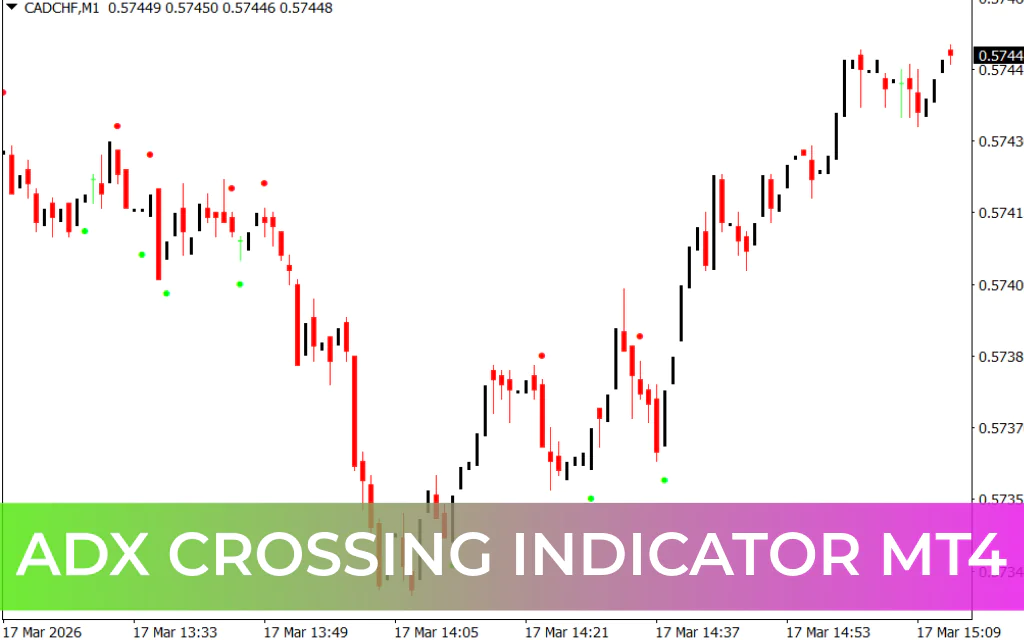
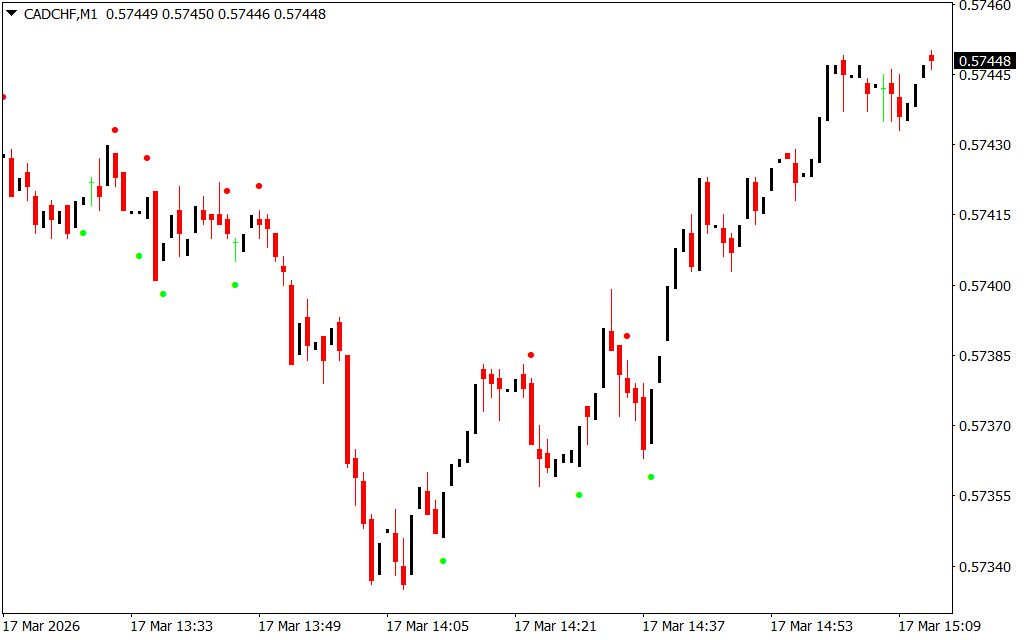
It displays:
- Green dots – Indicating potential BUY signals
- Red dots – Indicating potential SELL signals
These dots appear on the chart whenever the underlying ADX directional signals confirm a potential market move.
Because of this simplified visualization, traders can quickly identify trend direction and possible entry points without manually analyzing indicator crossovers.
Trading with the ADX Crossing Indicator
The indicator can be used as a standalone trading tool to identify potential long and short trades. However, it is recommended to combine it with Price Action analysis and basic technical tools to improve accuracy.
One effective approach is to combine it with:
- Support And Resistance levels
- Candlestick patterns
- Trendline analysis
This combination helps reduce the number of false signals and improves overall trade quality.
Example Strategy Using Support and Resistance
Consider a chart of the GBP/USD on the H4 timeframe.
Sell Signal Example
- The price breaks below a support level, which then turns into resistance.
- The market retests the resistance zone multiple times.
- When the price forms a bearish candlestick pattern and the ADX Crossing Indicator prints a red dot, traders can consider entering a short position.
Examples of bearish confirmation patterns include:
- Bearish engulfing candle
- Spinning top near resistance
Each time the resistance level is tested and a red dot appears, it can signal another opportunity to enter a sell trade.
Buy Signal Example
A buy opportunity occurs when the market reaches a strong support zone.
For example:
- Price tests a major support level.
- A bullish candlestick pattern forms, such as a bullish engulfing candle.
- The ADX Crossing Indicator displays a green dot, confirming a potential buy signal.
This combination suggests that buyers are gaining control, and a potential upward move may follow.
Best Timeframes for the Indicator
The ADX Crossing Indicator works on most charts, but it performs best on:
- H1 (1 Hour)
- H4 (4 Hour)
- Daily timeframe
These timeframes typically provide more reliable signals and stronger trends.
Conclusion
The ADX Crossing Indicator for MT4, based on the principles of the Average Directional Index, makes it easier for traders to identify trend direction and entry points.
By simplifying the complex ADX crossover signals into clear buy and sell dots, the indicator becomes highly accessible for both beginner and experienced traders.
For the best results, traders should combine the indicator with price action, candlestick patterns, and support and resistance strategies to improve signal accuracy and avoid false entries.
FAQ
3 Downloads
Published:
Mar 17, 2026 10:15 AM
Category: