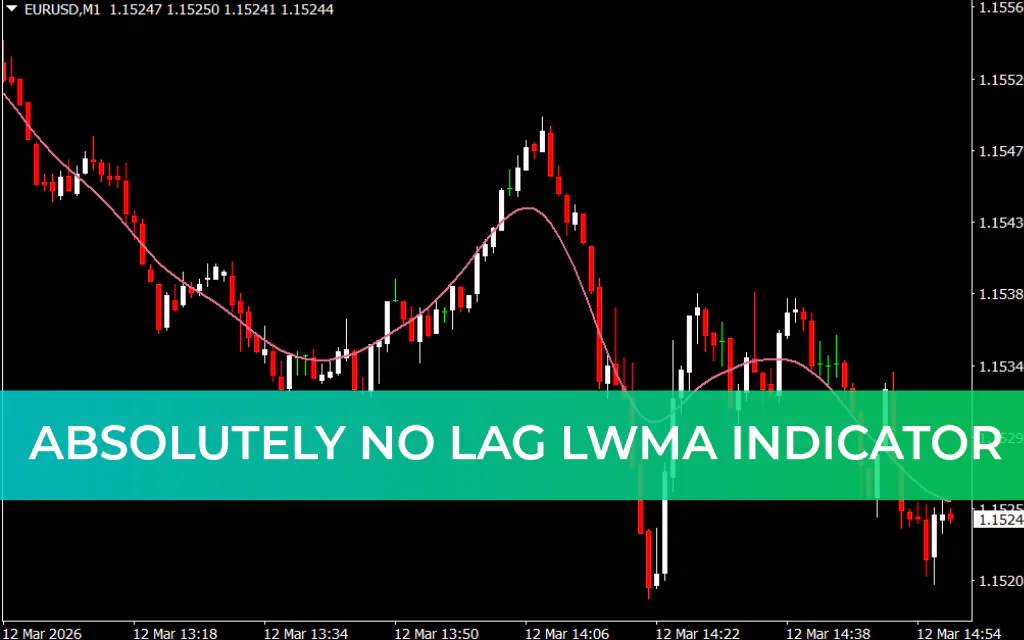
The Absolutely No Lag LWMA Indicator is a simple yet powerful trend-following tool designed for the MetaTrader 4 trading platform. It uses a 14-period Linear Weighted Moving Average (LWMA) to identify market direction and generate reliable buy and sell signals for forex and stock traders.
Unlike complex indicators that clutter charts, this indicator focuses on clear trend visualization. By analyzing price interaction with the LWMA line, traders can easily determine whether the market is bullish or bearish and make informed trading decisions.
The indicator works smoothly across all timeframes, making it suitable for Scalping, intraday trading, and long-term strategies. It can also be applied to any tradable asset available on the MetaTrader 4 platform, including forex pairs, stocks, indices, and commodities.
How the Absolutely No Lag LWMA Indicator Works
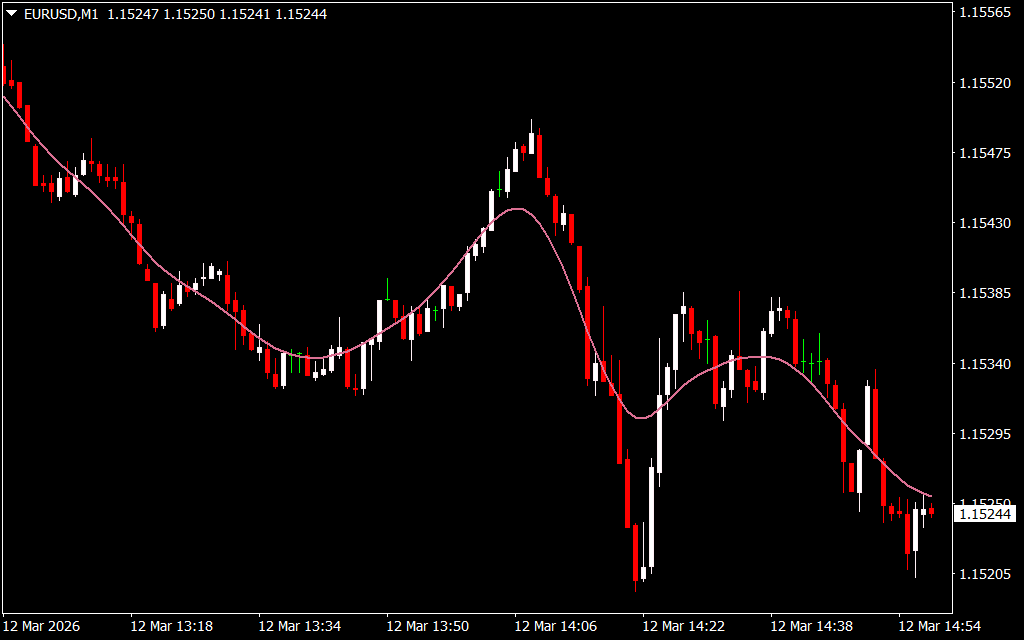
The indicator plots a Linear Weighted Moving Average line directly on the chart, reflecting the current least-square moving average value. Traders analyze how price behaves around this line to determine trend direction and potential trading opportunities.
Bullish Trend
A bullish trend is identified when:
- The LWMA line slopes upward
- Price candles consistently close above the LWMA line
This scenario indicates strong buying pressure and suggests that traders may look for buy opportunities.
Bearish Trend
A bearish trend occurs when:
- The LWMA line slopes downward
- Price candles close below the LWMA line
This signals selling pressure and allows traders to consider sell positions.
Using LWMA for Support and Resistance
One of the key advantages of the Absolutely No Lag LWMA indicator is that it acts as a dynamic Support And Resistance level.
- During an uptrend, the LWMA line often serves as dynamic support, where price may bounce upward.
- In a downtrend, it behaves as dynamic resistance, where price may reject and continue falling.
This feature helps traders identify optimal stop-loss placement and manage risk effectively.
Example Trading Setup
Consider a situation where price approaches a major resistance level and fails to break above it.
- The market rejects the resistance zone.
- Price moves below the LWMA line, confirming bearish momentum.
- A sell trade can be triggered once the candle closes below the indicator.
Stop Loss Placement:
- Above the resistance level, or
- Slightly above the LWMA line.
Trade Exit:
- Close the sell position when price starts closing consistently above the LWMA line, signaling a potential Trend Reversal.
Why Traders Use the Absolutely No Lag LWMA Indicator
Key benefits include:
- Simple and easy-to-understand trend signals
- Works on all timeframes
- Compatible with multiple financial instruments
- Identifies dynamic support and resistance levels
- Helps determine stop-loss and exit zones
For improved accuracy, traders often combine the indicator with support and resistance levels, Price Action, and historical price channels.
Conclusion
The Absolutely No Lag LWMA Indicator is an excellent choice for beginner and experienced traders who prefer a clean and reliable trend-following tool. Its simple moving average structure makes it easy to interpret market direction, identify entry opportunities, and manage trades effectively.
When combined with proper technical analysis techniques such as support/resistance and price channels, the indicator can significantly improve trend identification and trade timing on the MetaTrader 4 platform.
FAQ
Published:
Mar 12, 2026 10:00 AM
Category: